
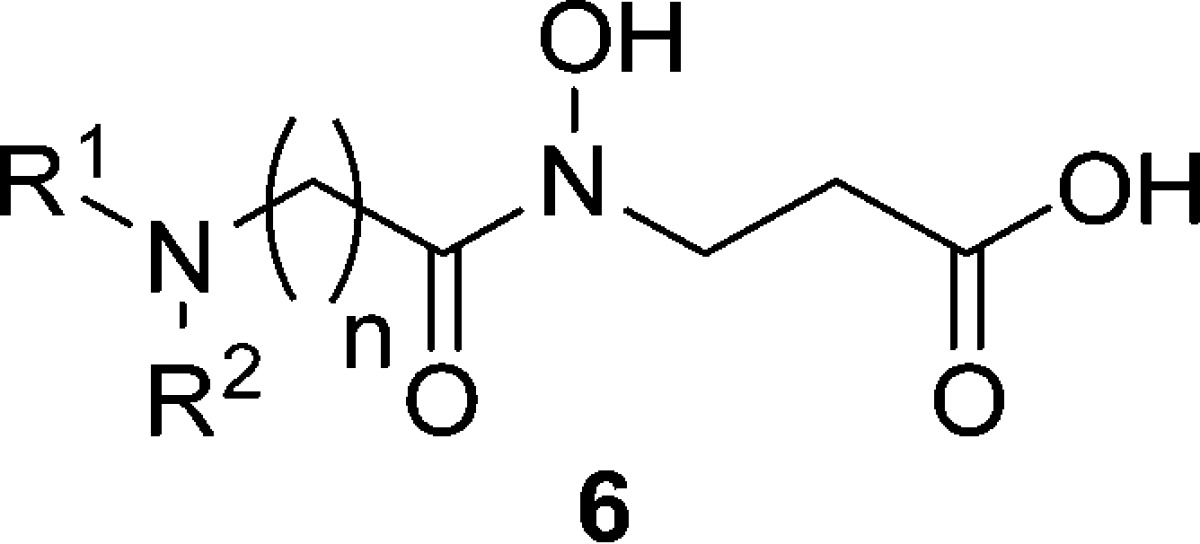
Table 1. In Vitro JARID1A, JMJD2C, JMJD1A, and JHDM1F Inhibitory Activities of Compounds 1–4 and 6a.
| structure |
IC50 (μM) |
|||||||
|---|---|---|---|---|---|---|---|---|
| entry | compd | R1 | R2 | n | JARID1A | JMJD2C | JMJD1A | JHDM1F |
| 1 | 1 | 250 | 430 | 569 | 640 | |||
| 2 | 3b | 13 | 2.2 | NDc | 19 | |||
| 3 | 4b | 55 | 83 | NDc | 1.2 | |||
| 4 | 6a | n-Bu | Me | 4 | 4.3 ± 0.9 | 55 ± 11 | >100 | >100 |
| 5 | 6b | n-Bu | Me | 2 | 53 ± 8.5 | >100 | NDc | NDc |
| 6 | 6c | n-Bu | Me | 3 | 6.3 ± 1.8 | 63 ± 6.4 | NDc | NDc |
| 7 | 6d | n-Bu | Me | 5 | 4.0 ± 0.6 | 61 ± 1.6 | NDc | 58 ± 16 |
| 8 | 6e | n-Bu | Me | 6 | 1.8 ± 0.1 | 6.5 ± 0.3 | NDc | NDc |
| 9 | 6f | Me | Me | 4 | 18 ± 2.0 | 51 ± 6.3 | NDc | NDc |
| 10 | 6g | Et | Me | 4 | 7.8 ± 1.0 | 62 ± 11 | NDc | NDc |
| 11 | 6h | n-Pr | Me | 4 | 8.9 ± 3.0 | 76 ± 4.7 | NDc | NDc |
| 12 | 6i | n-pentyl | Me | 4 | 2.3 ± 0.9 | 37 ± 26 | >100 | >100 |
| 13 | 6j | n-hexyl | Me | 4 | 3.3 ± 1.3 | 43 ± 11 | >100 | 73 ± 9 |
| 14 | 6k | n-Bu | Et | 4 | 14 ± 5.0 | 65 ± 13 | NDc | NDc |
| 15 | 6l | n-Bu | n-Bu | 4 | 19 ± 6.2 | >100 | NDc | NDc |
| 16 | 6m | n-Bu | n-hexyl | 4 | 4.5 ± 0.9 | >100 | >100 | 29 ± 13 |
| 17 | 6n | n-Bu | n-octyl | 4 | 3.1 ± 0.3 | 83 ± 17 | >100 | 24 ± 8 |
| 18 | 7i | 63 ± 16 | NDc | NDc | NDc | |||
| 19 | 7j | 21 ± 3.7 | NDc | NDc | NDc | |||
a
Value are means of at least three experiments.
b
Taken from the literature (ref (22)).
c
ND = no data available.