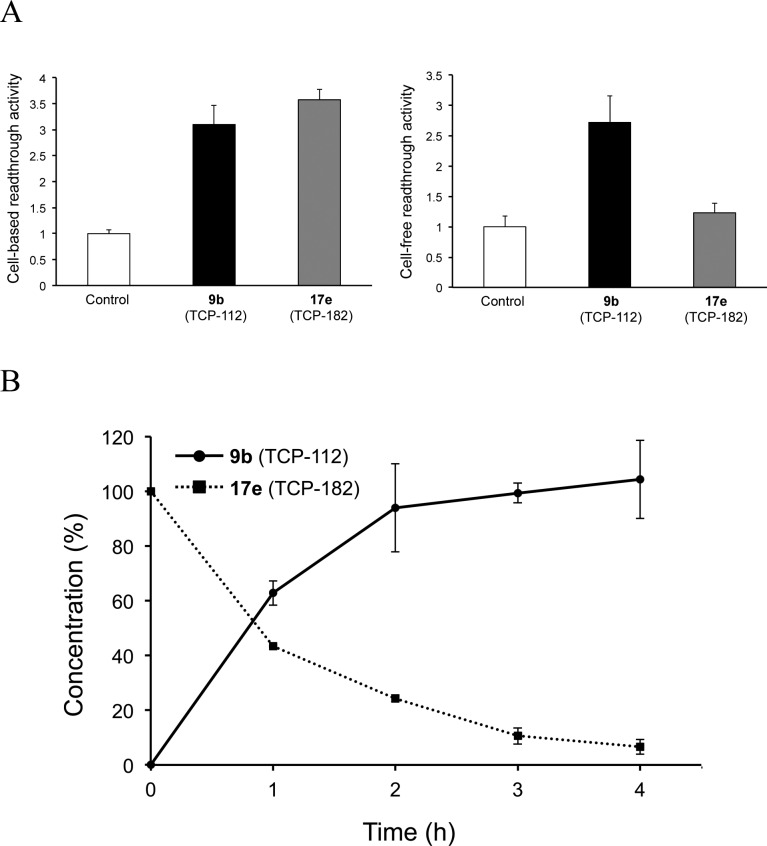
Figure 3.
(A) Readthrough activity in cell-based and cell-free assays. Readthrough activity (ratio) of the compound against that of control (= 1) is shown. Cell, COS-7; compound concentration, 200 μM (cell-based assay, n = 3) or 20 μM (cell-free assay, n = 3). Error bars indicate ± SD. (B) Hydrolysis of 17e by porcine liver esterase. Compound concentration (%) is determined by RP-HPLC. Error bars indicate ± SD (n = 3).

