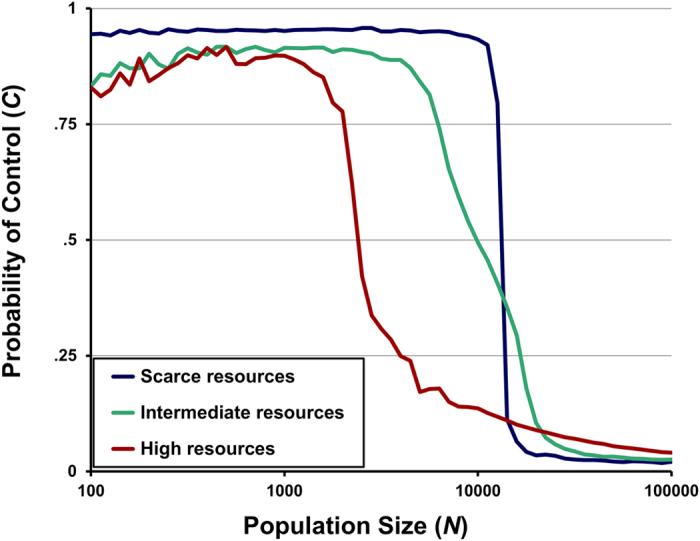
Figure 2. Equilibria depend on both population size N and environmental richness R.

The x-axis represents the population size N, while the y-axis represents the propensity for controlled processing C. Each line corresponds to a different value of environmental richness R, with each data point indicating the mean value of C at the end of 100,000 generations for a given combination of N and R. Values of R were .005, .025, and .125 for “scarce,” “intermediate,” and “high” resources, respectively.
