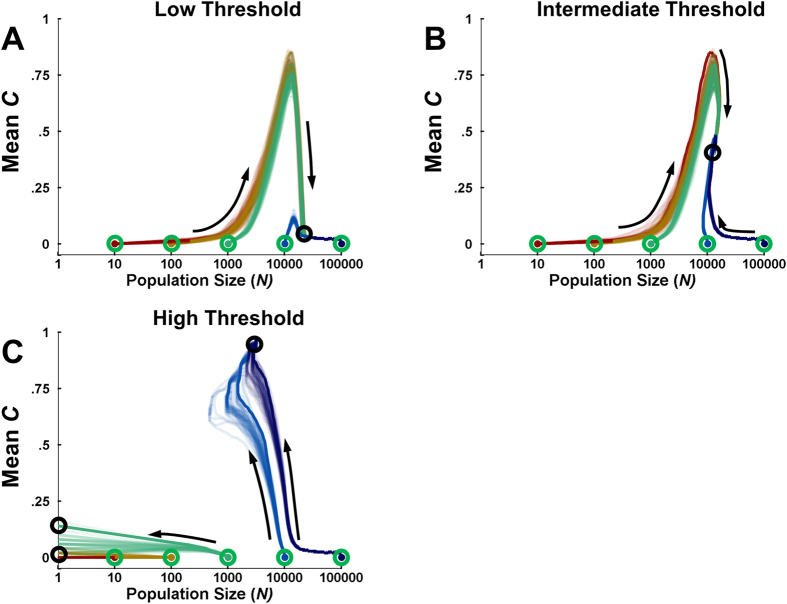
Figure 3. Variable population size simulations.
Each panel shows evolutionary trajectories, starting with a value of zero for controlled processing C but with incrementally larger initial population sizes (x-axis). For each set of trajectories, a single exemplar is shown with a dark line, with dark circles indicating the final disposition of these exemplars. (A) When the threshold TN was small and maintaining population size N was relatively easy, small populations evolved controlled processing until the increased population size made automatic processing more advantageous. (B) For an intermediate value of TN, populations reached a stable size only after evolving a moderate degree of C. (C) For high values of TN, populations required a very high fitness in order to maintain their current size, and only those that begin with high N evolved sufficient control to generate the needed fitness; smaller populations died out before they could do so. For all panels, the environmental richness R = .005.

