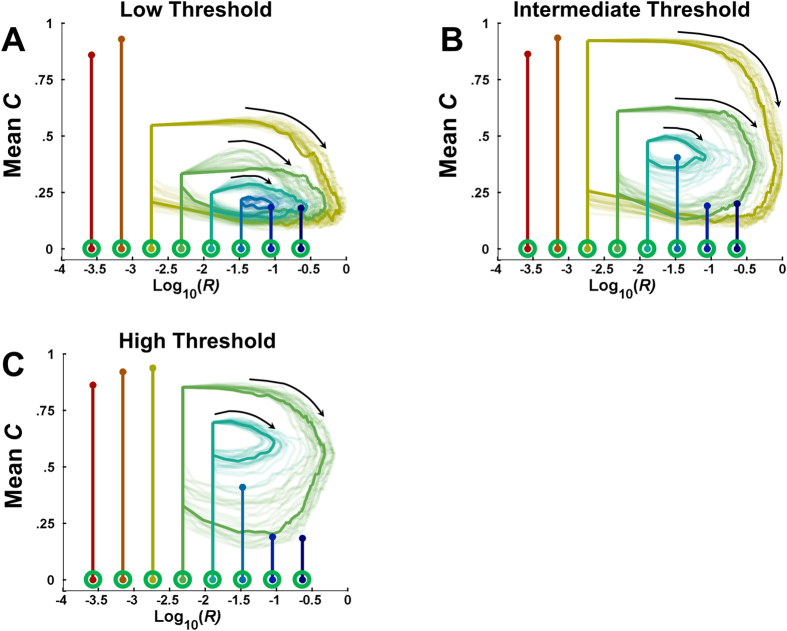
Figure 4. Variable richness simulations.
The lines in each panel shows evolutionary trajectories, starting with controlled processing C = 0 but with incrementally higher values of Ro (x-axis). For those populations that exhibit limit cycles, many cycles are depicted and a single exemplar is shown with a darker line. Population size N was fixed at 10,000 for all simulations. (A) When the performance threshold TR was small and several populations were able to modify environmental richness R. (B) A larger TR reduced the number of populations able to modify R, but increased the range of the resulting limit cycles. (C) When TR was large, only two populations achieved sufficient mean energy levels E and mean C to modify R.

