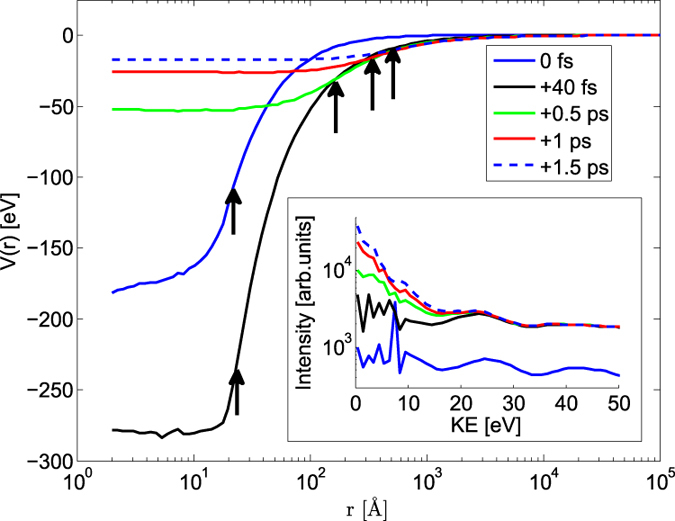
Figure 2.

Time evolution of trapping potential  within Ar1000 clusters irradiated with a 5 keV pulse at a peak fluence of 50 μJ/μm2. Arrows indicate the radius Rc of the Ar system, calculated as
  , where ri is the distance of Ar atoms from the center of the cluster, α = 5/3. Inset: volume integrated theoretical electron spectra for various times,
  . Smoothing was used at energies above 10 eV. The low energy plateau feature is formed during the pulse while the plasma emission peak develops during hundreds of femtoseconds after the pulse. The 10 fs FWHM Gaussian pulse is centered at t = 0 fs.
