Fig. 1.
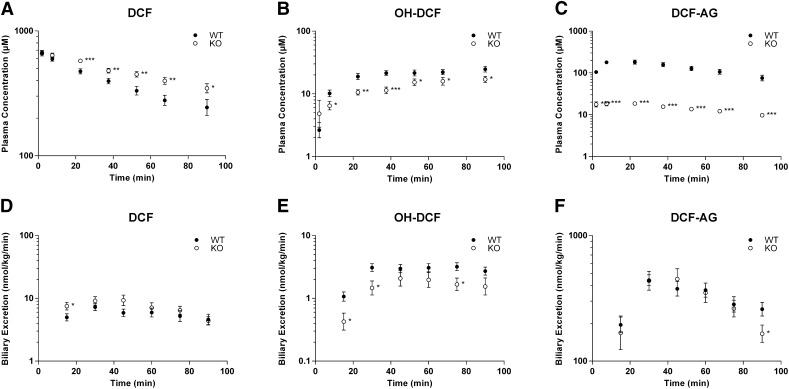
Toxicokinetics of DCF and its metabolites in FVB wild-type (WT, ●) and FVB Mrp3-null (KO, ○) mice after a single intra-arterial dose of 75 mg/kg DCF. (A–C) Plasma concentration profiles for DCF (A), OH-DCF (B), and DCF-AG (C) at discrete time points. (D–F) Biliary excretion profiles for DCF (D), OH-DCF (E), and DCF-AG (F). Time points represent biliary excretion during successive 15-minute intervals (0–15, 15–30, 30–45, 45–60, 60–75, and 75–90 minutes). All data are expressed as mean ± standard error of the mean for 10–12 subjects/group. *P < 0.05; **P < 0.01; ***P < 0.001 versus WT.

