Fig. 1.

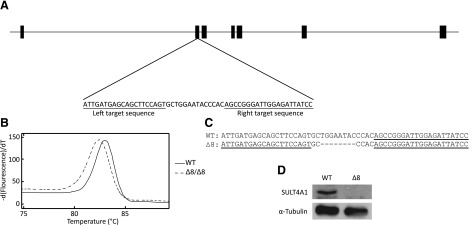
SULT4A1Δ8/Δ8 mutant generation. (A) Schematic of the zebrafish SULT4A1 gene with exons depicted as thick bars. Left and right TALEN target sequences are underlined. (B) SULT4A1Δ8/Δ8 fish were screened by HRMA analysis. WT and SULT4A1Δ8/Δ8 DNA showed a Tm difference of 0.6°C. (C) WT and SULT4A1Δ8 DNA sequence at mutation site. Left and right TALEN target sequences are underlined. Dashes represent single-nucleotide deletions. (D) Immunoblot analysis of WT (left) and SULT4A1Δ8/Δ8 (right) brain lysate. Wells were loaded with 86 µg protein, and membrane was probed with an anti-hSULT4A1 or anti–α-tubulin antibody.
