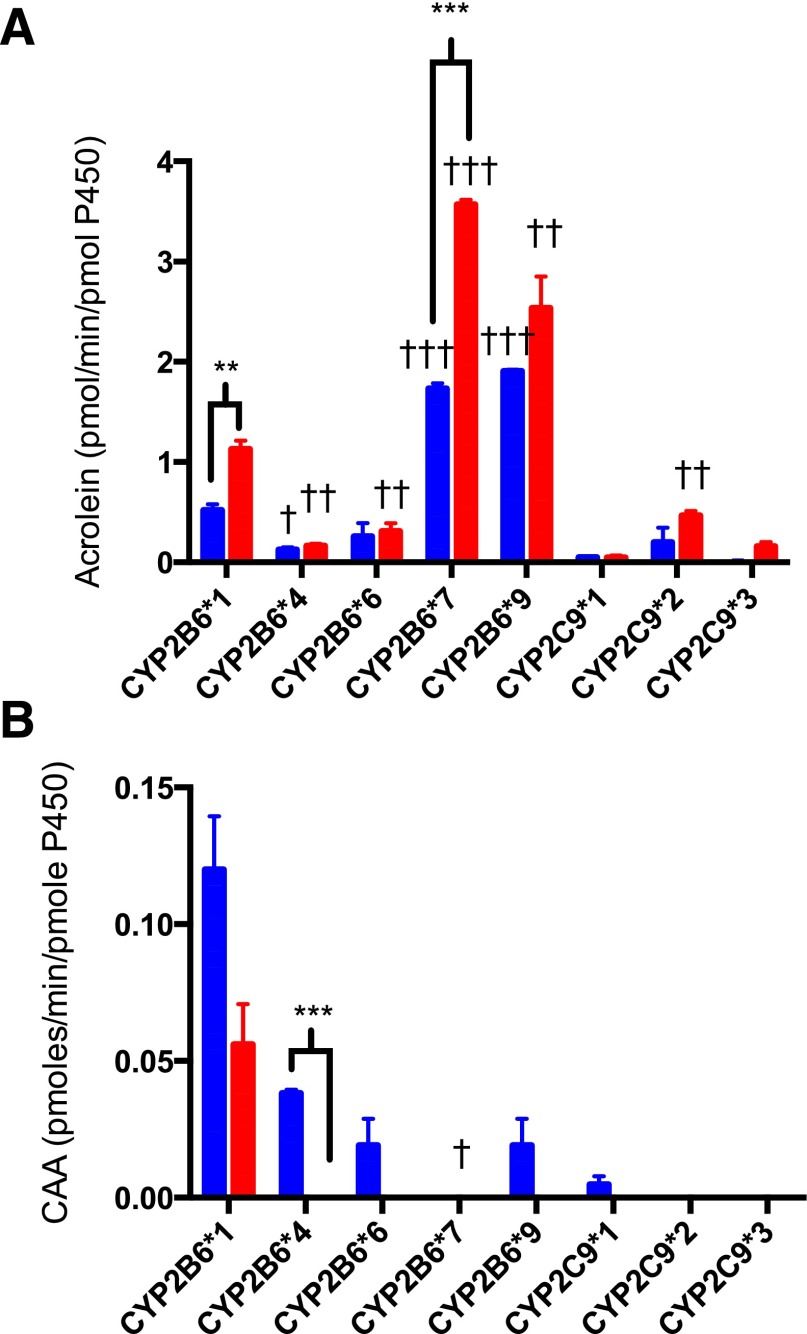
Fig. 4.
Metabolism of IFO and d4IFO by the polymorphic variants of CYP2B6 and CYP2C9. IFO (blue) or d4IFO (red) (1 mM) was incubated in the reconstituted system with 1 μM P450 for 30 minutes at 37°C. Half of each sample was analyzed for acrolein to determine the rate of activation of IFO for each of the polymorphic variants (A). The other half of each sample was analyzed for CAA to determine the rate of inactivation of IFO for each of the polymorphic variants (B). The details of the analytical methods are provided in Materials and Methods. The average for each experimental condition that was performed in triplicate is shown. Statistical significance was determined using an unpaired t test in Prism 6 (GraphPad Software, Inc.). †P < 0.05, ††P < 0.01, †††P < 0.005 for comparisons within polymorphic variants; **P < 0.01, ***P < 0.005 for comparisons between IFO and d4IFO. The data are summarized in Table 2.

