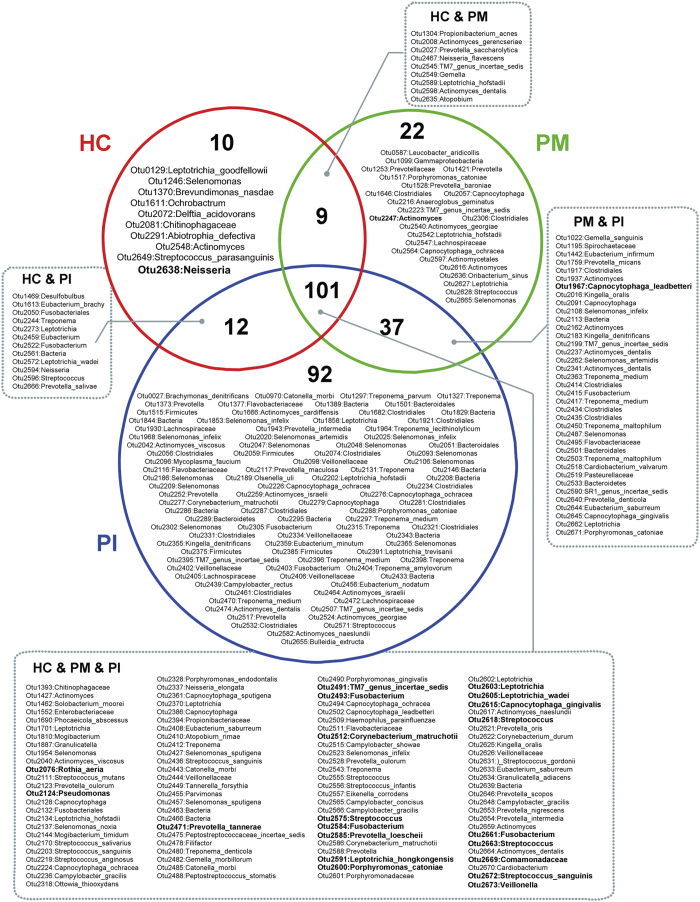
Figure 6. Venn diagram of the core microbiome of peri-implant sites.
Each circle (red, green or blue) contains OTUs present in at least 50% of subjects within a group. OTUs in the overlapping regions were shared by two or three groups. Numerically dominant OTUs with mean relative abundances >0.5% are shown in bold.

