FIG 2.
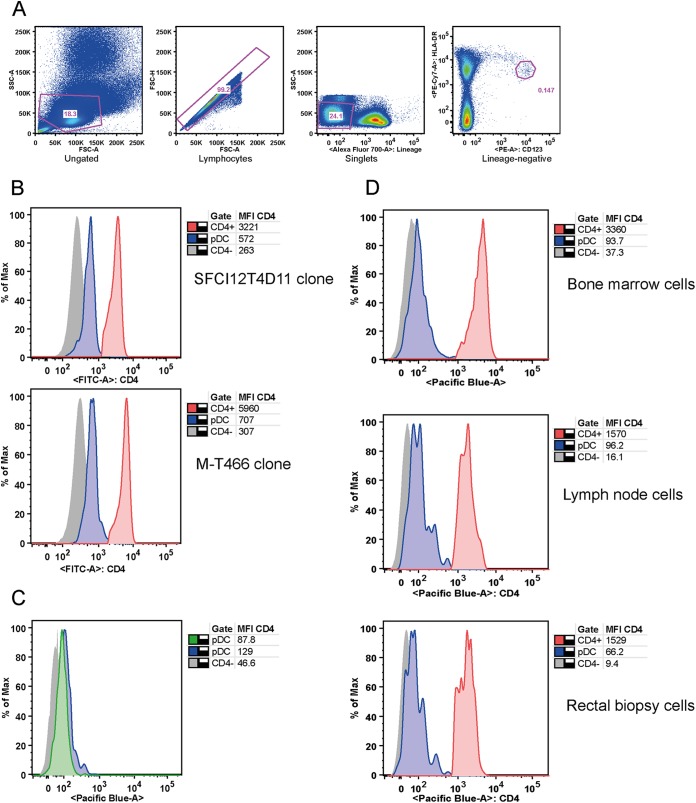
Low CD4 expression on AGM pDC. (A) Dot plots showing the gating strategy used to identify pDC [forward-scatter and side-scatter (FSC/SSC) gated, singlets, Lineage (CD3/CD20), and HLA-DR CD123hi cells] for one representative animal. PE, phycoerythrin. (B) Low CD4 expression on AGM pDC (n = 3) was confirmed using two additional monoclonal anti-CD4 antibodies (M-T466 and SFCI12T4D11). Histograms of representative animals are shown, depicting CD4 expression on CD4− cells (gray, solid), pDC (blue, solid with contour), and Lineage+ CD4+ cells (red, solid with contour). MFI values of CD4 for the three cell populations are shown in the table. FITC, fluorescein isothiocyanate; max, maximum. (C) Intracellular and extracellular staining of AGM pDC (n = 3). Histograms for a representative animal are shown, cell surface CD4 expression is depicted for CD4− cells (gray, solid) and for pDC, and intracellular (blue, solid with contour) and extracellular (green, solid with contour) expression is shown, indicating the absence of an intracellular CD4 pool in AGM pDC. (D) Low CD4 expression was observed on pDC from bone marrow samples (n = 1 AGM), LN samples (n = 1 AGM), and rectal biopsy specimens (n = 1 AGM). Histograms depict CD4 expression on CD4− cells (gray, solid), pDC (blue, solid with contour), and Lineage+ CD4+ cells (red, solid with contour). MFI values of CD4 are listed in the tables.

