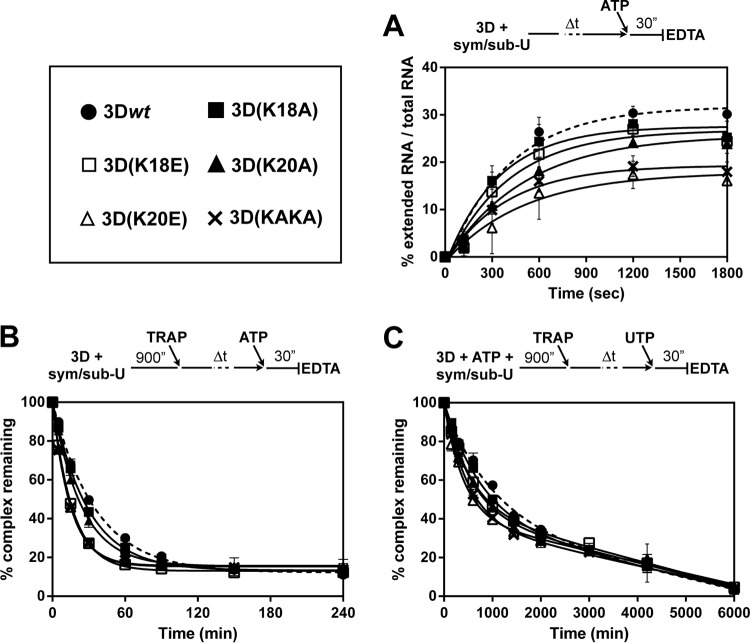
FIG 2.
Association and dissociation of FMDV 3Dpol-sym/sub-U complexes. (A) Kinetics of assembly of FMDV 3Dpol-sym/sub-U complexes. 3D proteins were incubated with labeled sym/sub-U, and ATP (50 μM) was added after 0, 2, 5, 10, 20, and 30 min; the reaction was allowed to proceed for 30 s and then was quenched by the addition of EDTA (83 mM). The percent RNA elongated at the indicated preincubation times was fit to a single exponential equation. Association of 3Dwt to RNA is represented as a dashed line. The values are the averages of three determinations, and standard deviations are given. (B) Kinetics of dissociation of FMDV 3Dpol-sym/sub-U substrate and 3Dpol-sym/sub-U product complexes. FMDV 3Dpol (3 μM) was incubated with stoichiometrically 32P-labeled sym/sub-AU (0.5 μM duplex) for 900 s at 37°C, at which point a trap (25 μM unlabeled sym/sub-U to trap polymerase molecules not bound to the labeled sym/sub) was added to the reaction mixture. At times 0, 5, 15, 30, 90, 150, 240, and 360 min after the addition of the trap, ATP (50 μM) was added, and the reaction was allowed to proceed for 30 s and was then quenched by the addition of EDTA (83 mM). The graph shows the percentage of complexes remaining at the indicated preincubation times of RNA with the different 3D polymerases. Data were fit to a one-phase exponential decay equation ♣CHK♣[A = (A0 − B) · exp(−koff · t) + B, where A is the amount of 3D-RNA complexes, B is the total amount of remaining complexes, and t is time)♣CHK♣. Dissociation of 3Dwt from RNA is represented as a dashed line. The values are the averages of three determinations, and standard deviations are given. (C) Kinetics of dissociation of FMDV 3Dpol-sym/sub-U substrate and 3Dpol-sym/sub-U product complexes. Reactions were performed as described for panel B but contained ATP (10 μM) during the assembly reaction. At times 0, 150, 300, 600, 1,000, 1,440, 2,000, 3,000, 4,200, and 6,000 min after the addition of the trap, UTP (50 μM) was added. The graph shows the percentage of complexes remaining at the different preincubation times of RNA with the different 3D polymerases. Data were fit to a biphasic exponential function, where the fast phase represented the dissociation [Fast = (A0 − B) · %Fast · 0.01, where A is the amount of 3D-RNA complexes and B is the total amount of remaining complexes)♣CHK♣. Dissociation of 3Dwt from RNA is represented as a dashed line. The values are the averages of three determinations, and standard deviations are given.

