
FIG 3.
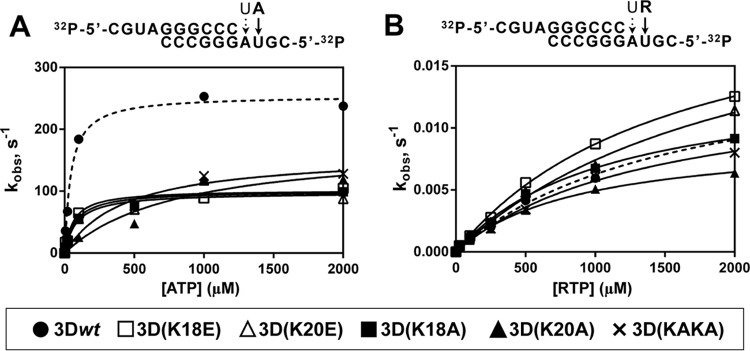
Pre-steady-state kinetics of nucleotide incorporation by 3Dwt and mutants. Above each panel, the nucleotide sequence of 5′-end-labeled and annealed sym/sub used and the nucleotides to be incorporated are depicted. (A) 3D enzymes were preincubated at 37°C with sym/sub-AU and UTP for 900 s at 37°C to allow the formation of 3D-RNA product complex, with UMP incorporated at the first position (discontinuous arrow on sym/sub RNA). The 3D-RNA product was then mixed with ATP using a rapid chemical quench-flow apparatus, and reactions were quenched by addition of EDTA (0.5 M). Time courses at fixed nucleotide concentrations were fit to an exponential curve to obtain the observed rate constant (kobs) for nucleotide incorporation at the second position. The observed rate constants were then plotted as a function of nucleotide concentration, and the data were fit to a hyperbola to obtain the maximal observed rate constant for nucleotide incorporation (kpol) and the apparent dissociation constant (Kd,ATP). From these constants the efficiency of incorporation of the NTP substrate tested (kpol/Kd,ATP) was obtained (Table 3). Values for AMP incorporation by 3Dwt are represented with a dashed line. Procedures are further detailed in Materials and Methods. (B) 3D was preincubated at 37°C with sym/sub-AU and UTP for 900 s to allow the formation of 3D-RNA product complex, with UMP incorporated at the first position (discontinuous arrow on sym/sub RNA). The 3D-RNA product was then mixed with RTP, and reactions were quenched by addition of EDTA (83 mM). Time courses at fixed nucleotide concentrations were fit to an exponential curve to obtain the observed rate constant (kobs) for nucleotide incorporation at the second position. The observed rate constants were then plotted as a function of nucleotide concentration, and the data were fit to a hyperbola to obtain the maximal observed rate constant for nucleotide incorporation (kpol) and the apparent dissociation constant (Kd,RTP). From these constants the efficiency of incorporation of the NTP substrate tested (kpol/Kd,RTP) was obtained (Table 3). Values for RMP incorporation by 3Dwt are represented with a dashed line. Procedures are further detailed in Materials and Methods.