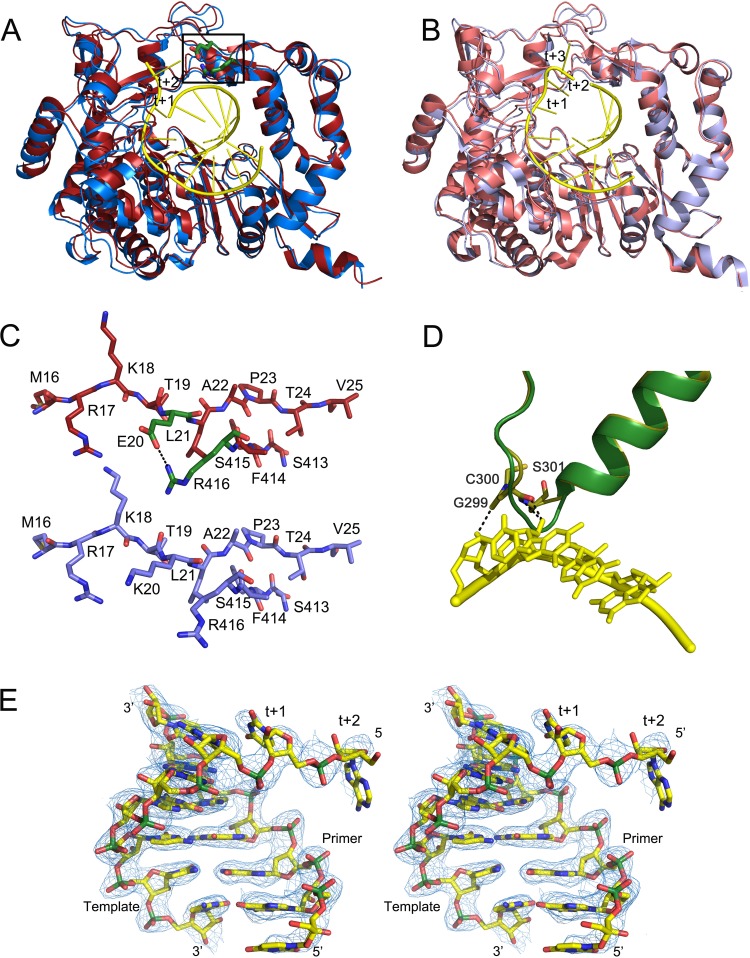
FIG 4.
Conformational changes in the 3D(K20E) and 3D(K18E) mutants on RNA binding. The figure shows structural superimpositions of the unbound (red) and RNA-bound (slate blue) structures of the 3D(K20E) mutant, showing the overall interdomain movements (A), compared with those of the 3Dwt structures (wt unbound, PDB accession number 1U09; wt RNA-bound, PDB 1WNE) (B). In the two panels, the bound RNA molecules are shown as sticks in yellow, with the downstream templating nucleotides at positions +1 and +2 explicitly labeled. Residues E20 and R416 that participate in the salt bridge linking fingers and thumb subdomains are shown as green sticks within the squared region. (C) Close-up of the squared region, showing the conformation and interactions around the E20-R416 salt bridge in the 3D(K20E) mutant (top), compared to the equivalent region in the 3Dwt. The RNA model is placed inside in atom-type sticks with carbons in yellow and phosphates in green. (D) Conformational rearrangement of the β9-α11 loop in the 3D(K18E) structure on RNA binding. The polymerase fragment is represented in green for the unbound state and in yellow sticks for the RNA-bound structure. The bound RNA template is also shown in yellow. (E) Stereo view of a σA-weighted 2|Fo| − |Fc| electron density map (1σ) around the RNA bound to the 3D(K20E) structure.

