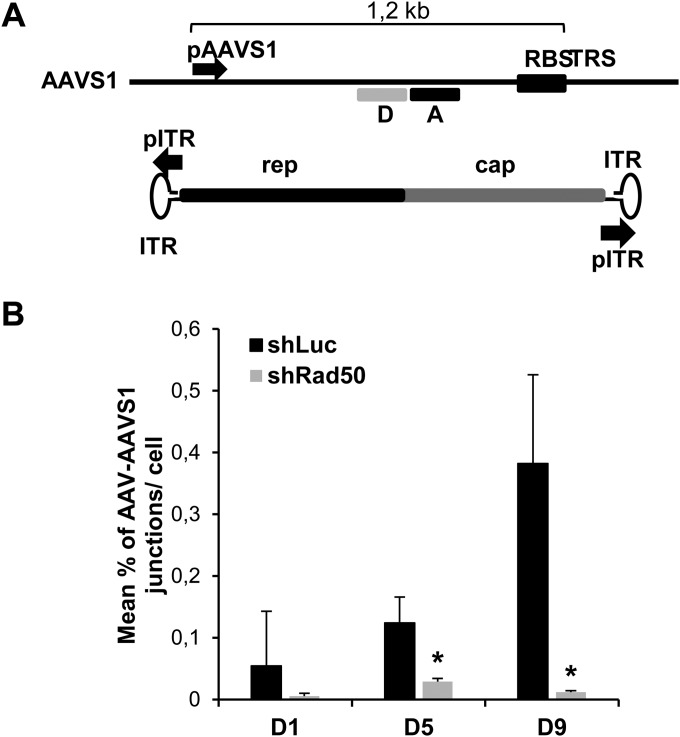
FIG 6.
Quantification of AAV integration within AAVS1 in the absence of a helper virus. (A) Schematic view of the AAVS1 site and of the wt AAV genome. The black arrows indicate the primers used to amplify the AAV-AAVS1 junctions by TaqMan qPCR. The boxes labeled “D” and “A” indicate the positions of the donor and acceptor probes, respectively. RBS, Rep-binding site; TRS, terminal resolution site. (B) AAV junctions levels were measured in HeLa shRad50 and HeLa shLuc cells infected with wt AAV (MOI, 103 GP/cell) in the absence of a helper virus. Genomic DNA was extracted at the indicated days p.i. and analyzed by TaqMan qPCR as described above. Results are expressed as percent AAV-AAVS1 junctions per cell (means and SD). *, P < 0.05.

