
FIG 7.
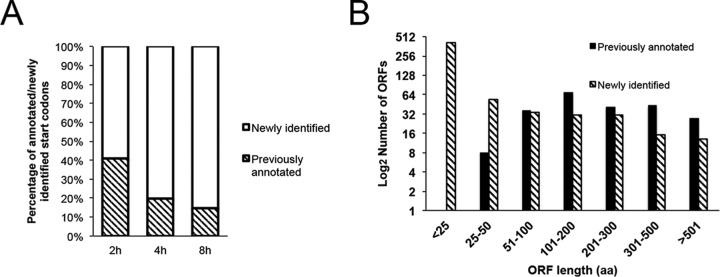
Comparison of the previously annotated and newly identified translation initiation sites. (A) Percentages of annotated and newly identified putative translation initiation sites at 2, 4, and 8 h of infection. (B) Size distribution of ORF lengths in amino acids (aa) associated with previously annotated and newly identified putative translation initiation sites.