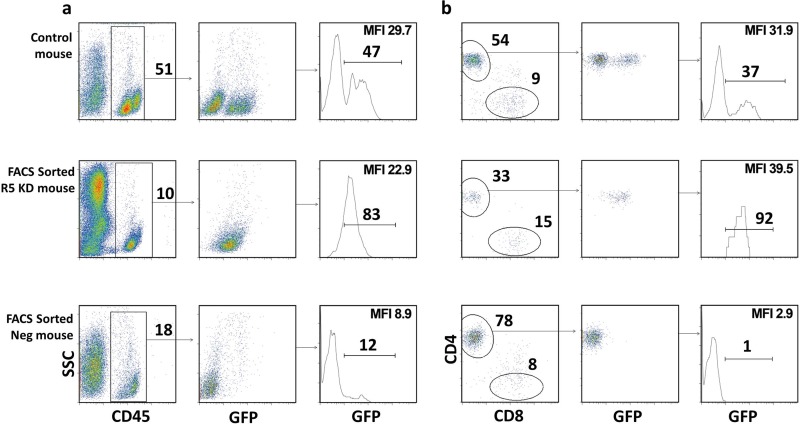
FIG 2.
GFP-positive CCR5 knockdown sorted CD34+ HSPCs produced mice with “pure” populations of transduced cells in vivo. (a) FACS plots showing the percent human engraftment of CD45+ (percentage of live cells) and GFP-positive CD45+ (percentage of human CD45) cells for representative control-transduced, FACS-sorted R5 knockdown, and FACS-sorted negative mice before HIV infection. (b) FACS plots showing the percentage CD4+ T cells (percent CD3+), CD8+ (percent CD3+), and GFP-positive CD4+ T cells (percent CD4+) in the peripheral blood before HIV infection of the same mice as in panel a. For all cell subset analyses, the subgating was done as follows: total live cells and CD45+, CD3+, CD4+, and CD8+ cells. Mean fluorescence intensity (MFI) for GFP is indicated.

