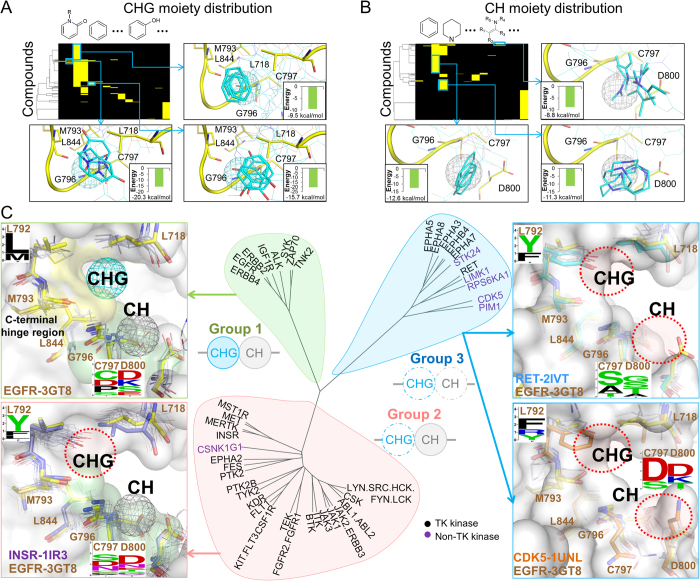
Figure 2. Anchor-based classification of tyrosine kinases.
Interacting moiety profiles of (A) CHG and (B) CH anchors. An entry is colored yellow if the compound has a moiety that interacts with the anchor residues; otherwise, the entry is colored black. The frequently interacting functional groups and their average binding energy are shown near the profile. The moieties with a low binding energy can be used for the lead optimization process. (C) Classification tree and anchor residue patterns of three groups. The tree was constructed by considering the anchor presence and the anchor residue identities. Group 1 kinases contain CH and CHG anchors. The structures of EGFR and the other Group 1 kinases are shown as yellow stick and white line representations, respectively. Group 2 kinases lack the CHG anchor because of the long and rigid residue types (residue F/Y) at the 792 position near the CHG anchor. In Group 3 kinases, the short side chains of the residues at the positions 793 and 796 result in elimination of the CH and CHG anchors.

