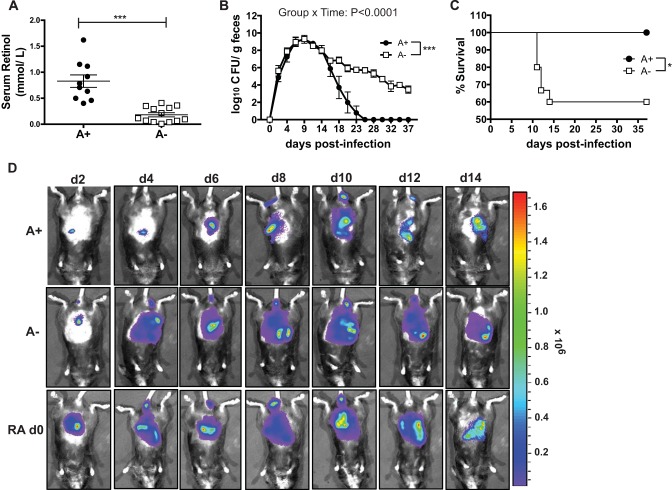
FIG 1.
A− mice are more susceptible to C. rodentium infection than A+ mice. (A) Serum retinol analysis from groups of 6- to 7-week-old A+ and A− mice. Each data point represents the serum retinol values in pooled samples from a different litter of mice (n = 10 to 13 litters). (B) C. rodentium CFU in the feces. Data are shown as means ± standard errors of the means and come from 1 representative of 5 independent experiments with n being 3 to 5/group. (C) Survival of A− and A+ mice during C. rodentium infection with data combined from 5 experiments (n = 9 to 15/group). (D) Whole-body imaging of A+, A−, and RA day 0 treated mice infected with bioluminescent C. rodentium and imaged. The image shows 1 mouse from a total of 3 to 4 mice/treatment group. Means of the bioluminescence from all the mice are shown in Fig. S1 in the supplemental material. (A) Two-tailed Student t test; (B) two-way ANOVA with Bonferroni post hoc tests; (C) log rank test. *, P < 0.05; **, P < 0.01; ***, P < 0.001.

