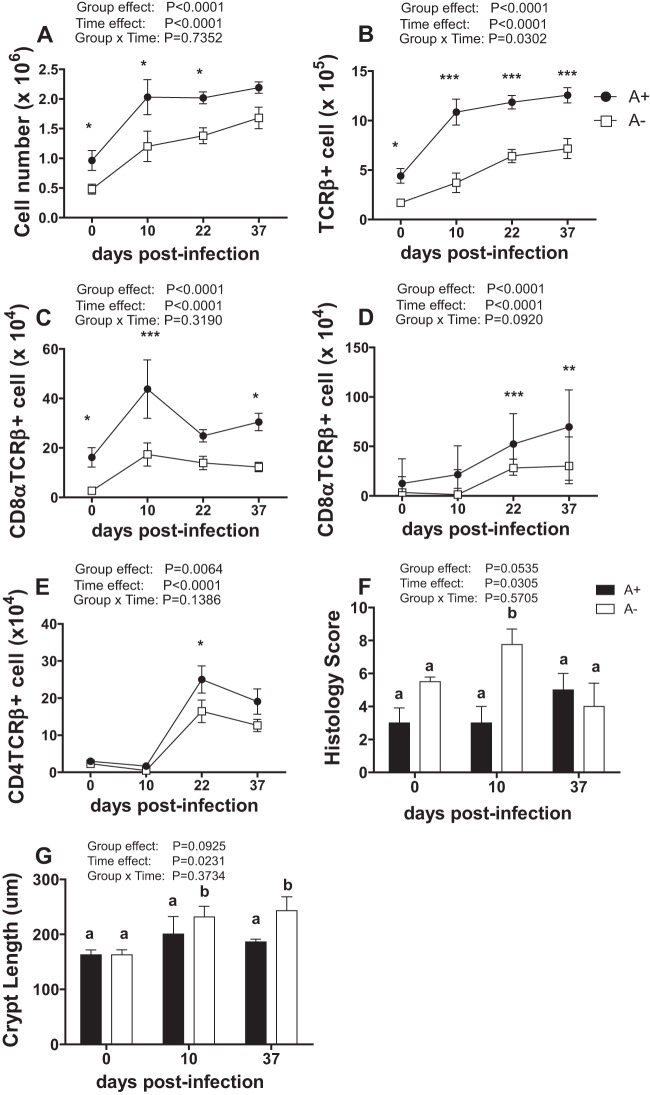
FIG 2.
T cells in the IELs of the colon from A+ and A− mice before and after infection. (A to E) Cell numbers in the colon IELs. (A) Immune cells. (B) TCRβ+ T cells. (C) CD8α+ T cells. (D) CD8αβ+ T cells. (E) CD4+ T cells. Values are the means ± standard errors of the means from combined data from 2 to 3 independent experiments with n being 6 to 15/group. Two-way ANOVA with Bonferroni post hoc tests. Asterisks indicate significant differences between groups at specific days by posttest: *, P < 0.05; **, P < 0.01; ***, P < 0.001. (F and G) Histology scores (F) and crypt length (G) of colons during infection. Values with different letters are significantly different from each other (P < 0.05).

