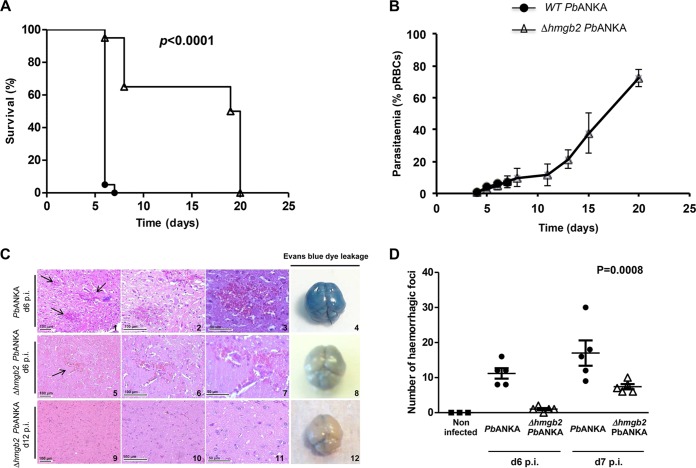
FIG 3.
Comparative analyses of C57BL/6 mice infected with WT P. berghei ANKA and Δhmgb2 ANKA parasites. (A) Kaplan-Meier survival plot for C57BL/6 mice infected with either 105 WT P. berghei ANKA or Δhmgb2 ANKA parasites. Infected mice were monitored every day, starting on d5 p.i., for ECM symptoms. The difference in survival between WT- and Δhmgb2 ANKA-infected C57BL/6 mice was analyzed by the log rank test. This experiment was performed 3 times (n = 4, n = 7, and n = 9). (B) Parasitemia of both parasites as measured by flow cytometry. Values represent means ± SD. (C) Histological analyses of brains from WT- and Δhmgb2 ANKA-infected C57BL/6 mice. The images show representative hematoxylin- and eosin-stained sagittal sections of brains harvested at d6 and d12 p.i. from WT (d6, panels 1 to 3)- and Δhmgb2 ANKA (d6, panels 5 to 7; d12, panels 9 to 11)-infected C57BL/6 mice (n = 5 for each experimental group). The black arrows indicate the hemorrhagic foci. In each row, two incremental magnifications of the same microscopic field are presented. Evans blue dye leakage in brains of WT (d6, panel 4)- and Δhmgb2 ANKA (d6, panel 8; d12, panel 12)-infected C57BL/6 mice is presented in the far right column. (D) Microscopic counts of the numbers of hemorrhagic foci per histological brain section at d6 and d7 p.i. (n = 5 for each experimental group). Multiple comparisons of focus numbers were analyzed by the Kruskal-Wallis test (with Dunn's multiple-comparison test; P = 0.0008).

