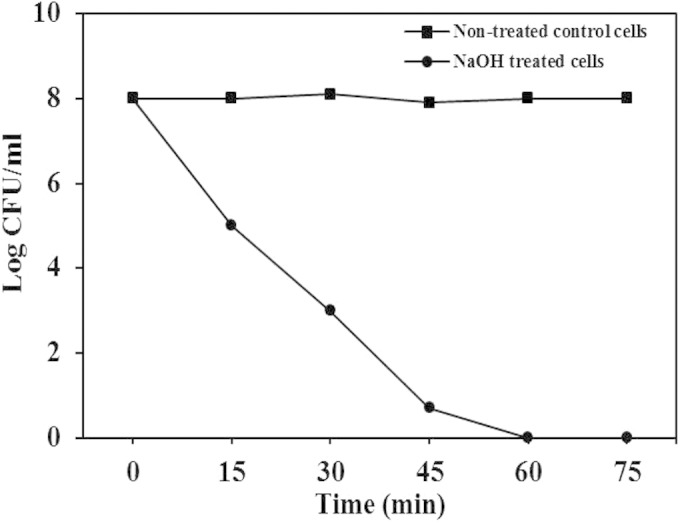
FIG 1.

Curves of S. aureus cell lysis at different time points (15, 30, 45, 60, and 75 min). The graph shows the lysis of bacterial cells treated with the MIC of NaOH and nontreated control cells. Lysis was measured by the number of CFU at 15-min intervals after treatment.
