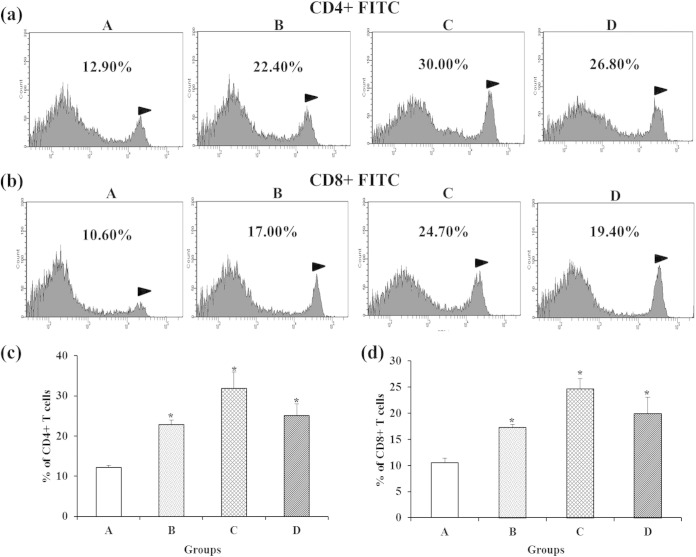
FIG 5.
Assessment of CD4+ and CD8+ T cells by FACS analysis. Shown are populations of CD4+ (a) and CD8+ (b) T cells and the corresponding analysis of significant differences (c and d) between immunized and nonimmunized groups 1 week (week 6) after the final immunization with SAGs. Groups: A, nonimmunized control; B, orally immunized; C, subcutaneously immunized; D, intravenously immunized. The values shown are means ± the standard errors of the means. The asterisks indicate significant differences between the T-cell populations of the immunized and nonimmunized groups (*, P < 0.05).

