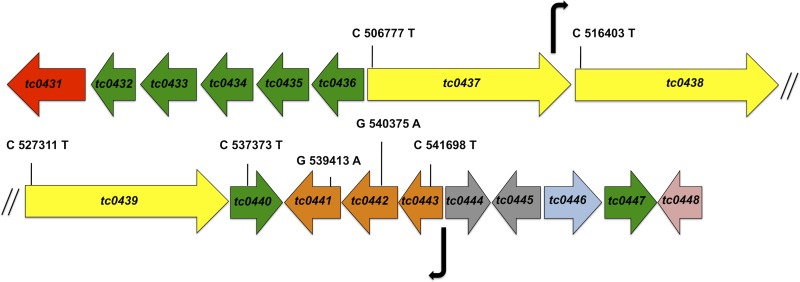
FIG 1.
Map of the C. muridarum PZ and diagram of PZ ORFs. The ORFs are color coded according to function: red, MACPF; green, PLD; yellow, cytotoxin; orange, purine nucleotide synthesis; gray, conserved hypothetical; blue, peptide ABC transporter; pink, dsbB. The locations of promoters identified by β-galactosidase assays in this study are shown by the bent arrows. The genomic locations and nucleotide changes of the nonsense mutations discussed in this study are indicated in the corresponding ORFs. The diagram is not drawn to scale.

