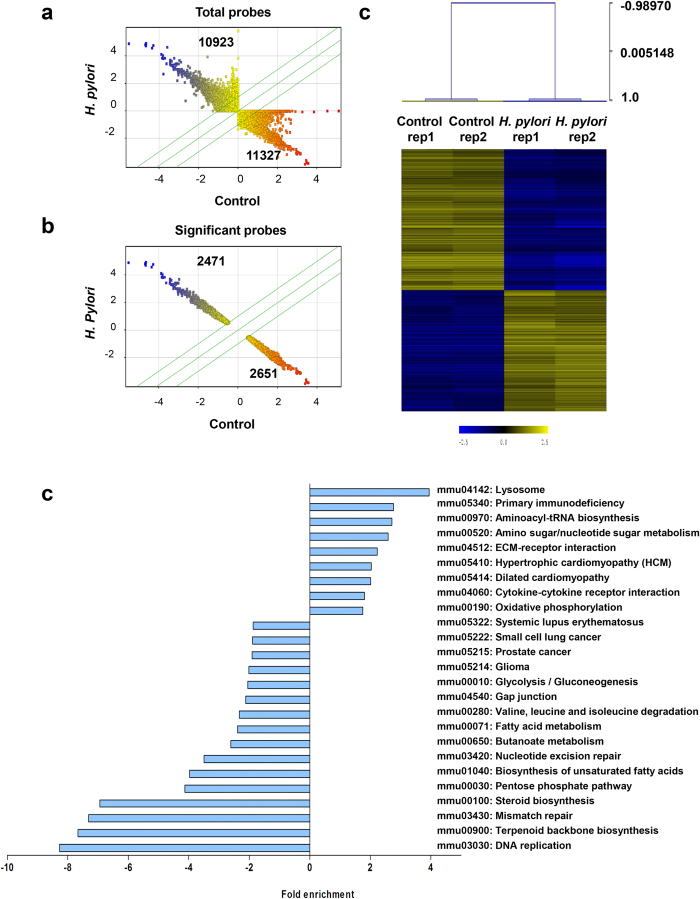
Figure 2. Microarray analysis of H. pylori-infected RAW264.7 cells.
(a and b) Scatter plots show the expressions of total probes (a) and significant probes (b), in the non-infected control versus H. pylori (MOI 10, 24 h)-infected cells. Significant probes were selected based on FC < –2 or FC > 2, P < 0.05. X and Y axis show normalized log2 values. Number represents the number of probes in each quadrant. Blue and red dots show the intensities of up- or down-regulated probes, respectively based on the normalized values on X-axis. Three green lines demarcate the probes with FC of –2, 0 and 2. (c) Hierarchical clustering (HCL) for significant 5122 probes (2932 genes) was executed with Pearson Correlation distance metric and average linkage. (d) KEGG pathway analysis. Bar chart showing the FE of significantly modulated pathways in the H. pylori-infected RAW264.7 cells relative to control (FE < –2 or FE > 2, P < 0.05). In total, 8 pathways showed induction while 16 pathways were reduced.

