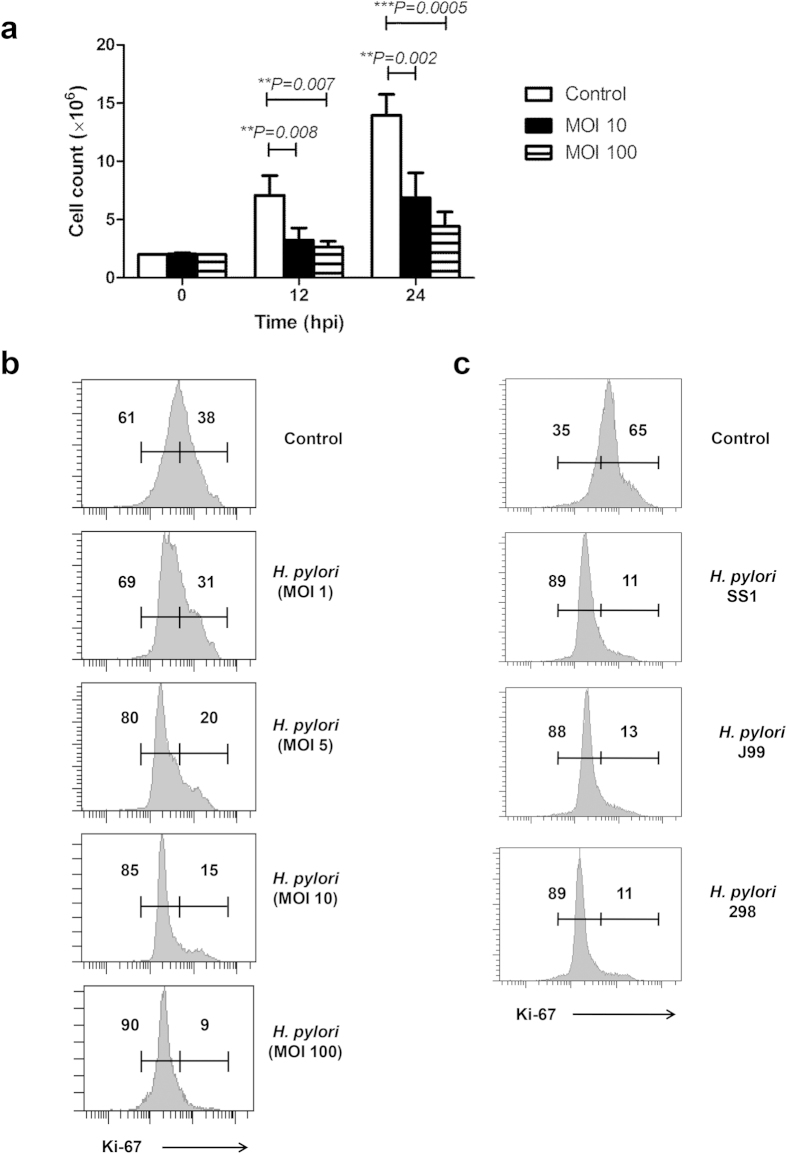
Figure 6. Effect of H. pylori infection on the cell proliferation of RAW264.7 cells.
(a) Bar chart shows absolute cell count of the non-infected and H. pylori-infected cells at 12 or 24 hpi. Data were shown as mean ± SD, from one experiment run in triplicate. Statistical significance were analyzed with unpaired Student’s t-test (**P < 0.01, ***P < 0.001). (b and c) Flow cytometrical analysis of intranuclear expression of Ki-67 cell proliferation marker in the control and H. pylori-infected cells. (b) RAW264.7 cells were infected with 1, 5, 10 and 100 MOIs of H. pylori SS1 strain for 24 h. (c) RAW264.7 cells were infected with different strains of H. pylori including SS1, J99 and 298 at MOI 100 for 24 h. Numbers represent the percentages of cells in the gated area. Shown were representative data of two independent experiments.

