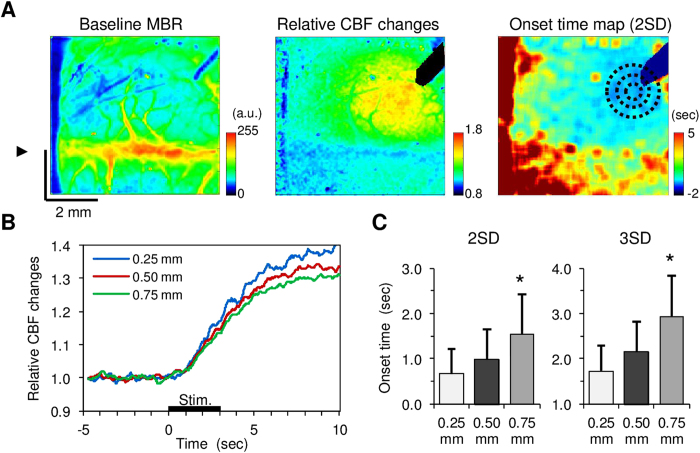
Figure 4. Spatiotemporal dynamics of CBF responses to transcranial photostimulation in ChR2 mice (N = 10).
A) A representative image of the mean baseline MBR averaged for 10-sec pre-stimulus periods (left). The arrowhead indicates the location of the midline. Broad CBF changes were evoked with photostimulation (centre). A rapid increase in CBF was observed around the irradiation spot while the CBF onset spread from the activation foci (right). Different size ROIs (0.50 mm, 1.0 mm, and 1.5 mm in diameter; black dot circles) were placed in a concentric fashion at the activation centre. B) Average time course of the CBF responses measured at distances of 0.25 mm, 0.50 mm, and 0.75 mm from the central point of the activation. C) Mean onset time for CBF responses measured at distances of 0.25 mm, 0.50 mm, and 0.75 mm from the central point of the activation. Two different thresholds (2-fold and 3-fold standard deviations (SD) of the 10-sec baseline fluctuations) were applied to calculate the onset time of the CBF responses (left and right, respectively). A significant difference in the CBF response onset time compared to the activation foci was consistently found at a distance of 0.75 mm (*p < 0.05).

