
Figure 3. Characteristic single molecule time traces as recorded by EMCCD detection unit.
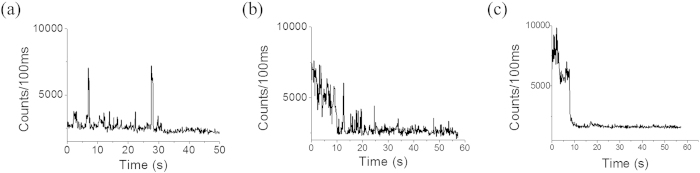
Figure (a) and (c) represents the fluorescence trace in presence of 5 mM methyl viologen and 5 mM ascorbic acid respectively. (b) represents fluorescence trace without any electron donor/acceptor. Brightness decreases in presence of methyl viologen and increases in the presence of ascorbic acid.