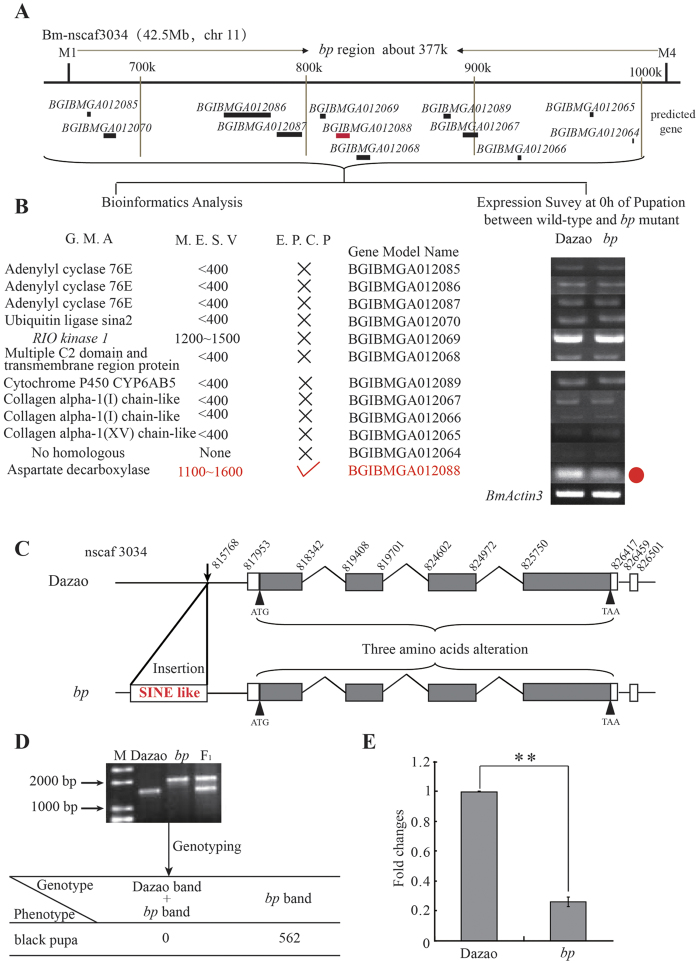
Figure 2. Genetic basis of the bp mutant.
. (a) Fine mapping of the bp locus. The bp locus was narrowed between the PCR markers M1 and M4, a region of ~377 kb. The solid line shows segment predicted gene models, and BGIBMGA012088 is marked in red. (b) Candidate genes in the 377 kb region. GMA, MESV, and EPCP represent Gene Mode Anotation, The Microarray Expression Signal Value (at 72 h of wandering or 0 h of pupation), and Evidence of Participating in Cuticle Pigmentation, respectively. The values of the Microarray Expression Signal less than 400 indicate that gene expression abundance is especially deficient53. The forked symbol represents deficiency of unambiguous evidence, whereas the red hook symbol represents existing unambiguous evidence. The red solid cycle represents an obvious expression difference of BGIBMGA012088 between wild-type and bp mutant silkworms. (c) Sequence differences of BmADC between wild-type and bp mutant silkworms. (d) Genotyping analysis between G1 (polymorphism marker) and the stony locus. M represents a DNA marker. (e) Relative expression levels of BmADC between wide-type and bp at 24 h of pupation under 24 °C. (Student’s t-test; n=3; **, p < 0.01). Data are presented as means ± SD.

