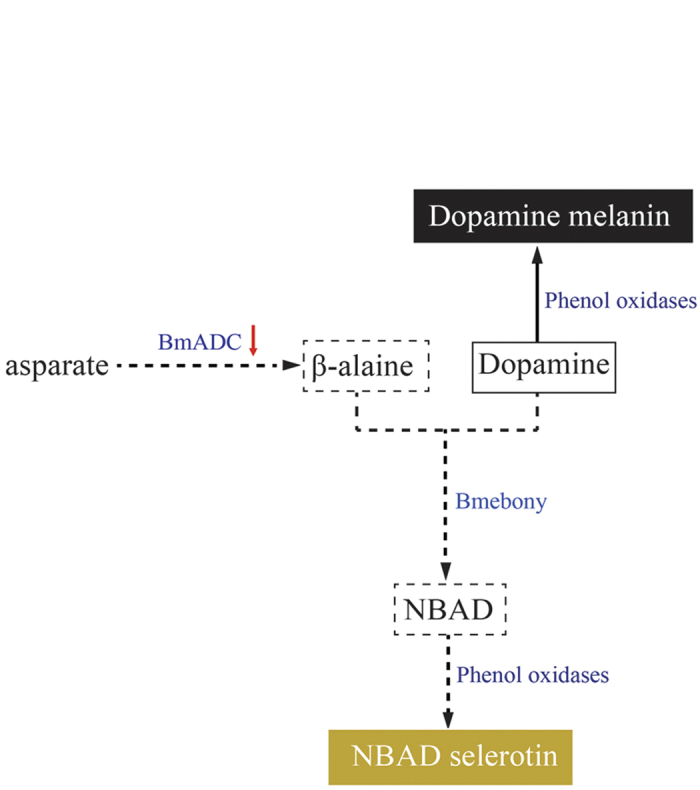
Figure 6. A schematic overview of the phenotype of the black pupa mutant.

. Enzymes are shown in blue. The red arrow represents the expression level of BmADC that was reduced sharply in the bp mutant. The dotted arrows indicated attenuated biochemical reactions. The solid arrow represents an intensive biochemical reaction. The solid and dotted frames represent the accumulation and insufficiency of biochemical components, respectively. The black box represents the color of Dopamine melanin. The yellowish box represents the color of NBAD selerotin.
