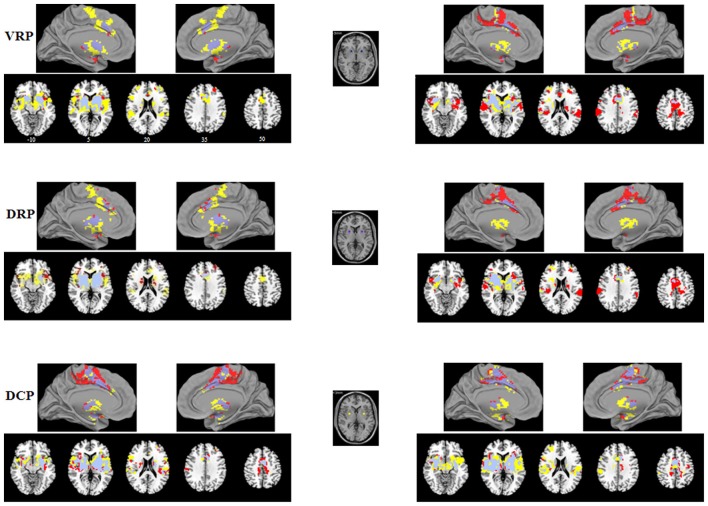
Figure 2.
Functional connectivity (FC) maps of the putamen seeds for each group. FC maps for IAD adolescents (red) and normal controls (HC; yellow) were generated separately and then overlaid together for display purposes; light purple color indicates overlapped areas for both groups. The left (right) column indicates the FC maps generated by left (right) putamen seeds. The middle column indicates the putamen seeds. The left side of the image corresponds to the left hemisphere of the brain. VRP, ventral rostral putamen; DRP, dorsal rostral putamen; DCP, dorsal caudal putamen.

