Figure 5.
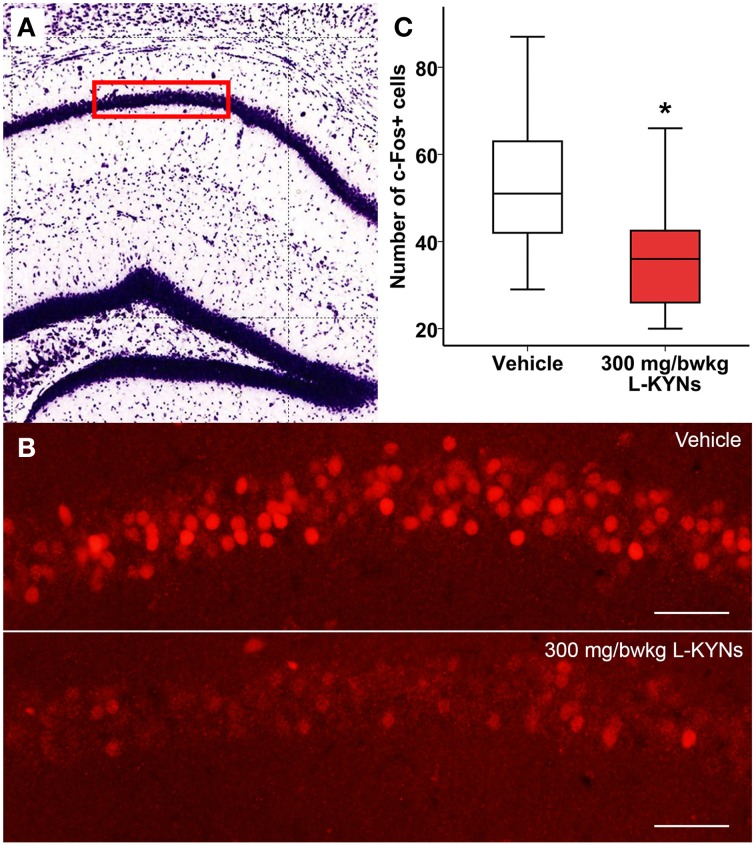
Effects of L-KYNs treatment on the number of c-Fos+ cells in the hippocampal CA1 area of C57Bl/6j mice. (A) Schematic illustration of the hippocampus. The red box (500 × 140 μm) indicates the captured and analyzed subregion of CA1. (B) Representative photomicrographs of c-Fos immunostaining in the CA1. There were a lower number of c-Fos+ cells in the L-KYNs-treated group (bottom panel) in comparison with the vehicle-treated group (top panel). Scale bars represent 50 μm. (C) Number of c-Fos+ cells in the CA1 area. The number of c-Fos+ cells was significantly reduced following L-KYNs administration. Data are shown as median, interquartile ranges ± minimum/maximum values (GLMM, *p ≤ 0.05; n = 20 animals).

