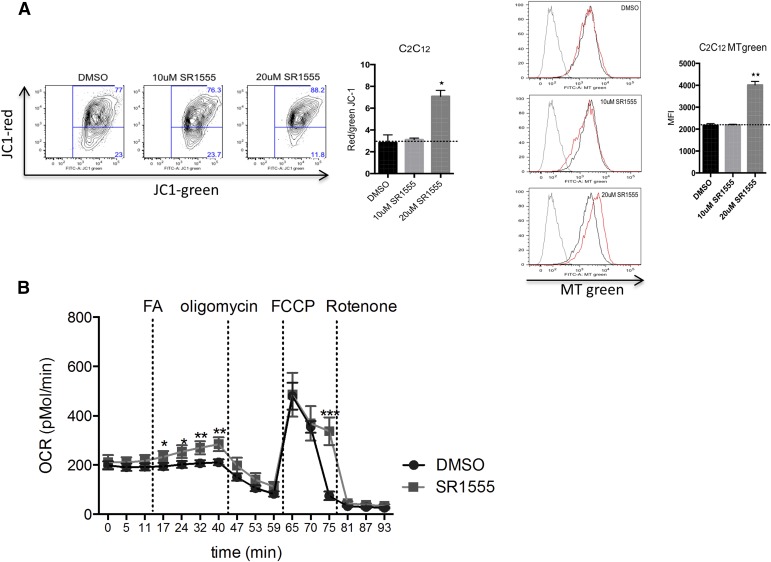
Fig. 6.
Fatty acid oxidation and modulation of mitochondrial respiration. (A) Functional mitochondria content in C2C12 cells was analyzed by flow cytometry using JC-1 and red/green JC-1 (the high-low mitochondrial membrane potential) mean fluorescent index (MFI) ratio (right, n = 3 per condition). Mitochondria content was measured by flow cytometry analysis using Mito Tracker (MT) Green staining (n = 3 per condition). (B) SVF cells were grown to confluence; incubated with dexamethasone, insulin, isobutylmethylxanthine, triiodothyronine (T3), and Rosiglitazone for 2 days to induce adipocyte differentiation; and then cultured with 20 μM SR1555, insulin, and T3. Oxygen consumption rates (OCRs) were measured by a Seahorse XF-96 flux analyzer (n = 10, three different conditions). Values are the mean ± S.E.M. of 10 samples per group. *P < 0.05, **P < 0.01, and ***P < 0.001 versus dimethylsulfoxide (DMSO), by Student’s unpaired t test. FA; fatty acid (oleic and linoleic acids); FCCP, carbonilcyanide p-triflouromethoxyphenylhydrozone.

