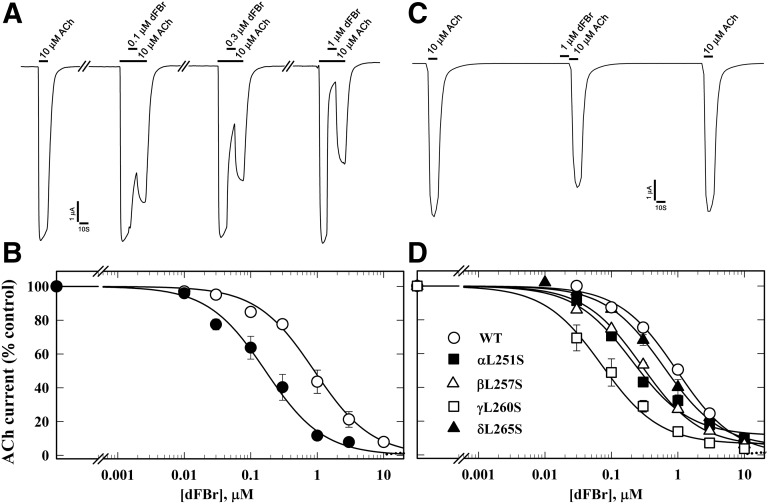
Fig. 3.
dFBr inhibition of Torpedo nAChR is enhanced in the presence of agonist and by mutations in the ion channel favoring the open state. (A) Representative traces showing the effect of dFBr on ACh-induced current responses when 10 µM ACh was applied for 10 seconds, followed by co-application of 10 µM ACh and dFBr for 10 seconds, and then 10 seconds of 10 µM ACh alone. (B) The concentration dependence of dFBr inhibition when co-applied with ACh as in (A), with the current measured at the end of dFBr co-application normalized to the current just before (⬤, IC50 = 0.12 ± 0.01 µM), compared with a parallel experiment quantifying dFBr inhibition of peak ACh responses without prior ACh exposure (○, dashed line, fit from Fig. 2 for data from 10 oocytes). (C) Representative traces showing the effect of preapplication of 1 µM dFBr for 10 seconds on nAChR sensitivity to ACh. The ACh responses were inhibited by ∼15 ± 3% (N = 6). (D) dFBr inhibition of mutant nAChRs containing leucine to serine substitutions at position M2-9′ within the ion channel, quantified from the peak current elicited by 10 µM ACh with co-application of dFBr normalized to the current in the absence of dFBr. IC50 values for wild type, α, β, γ, and δ M2-9′ mutants were 1.0 ± 0.07, 0.2 ± .04, 0.3 ± 0.03, 0.1 ± 0.02, and 0.5 ± 0.06 µM, respectively. For each dFBr concentration in (B) and (D), average ± S.E. of several replicas from at least three oocytes were plotted and fit to a single-site model.

