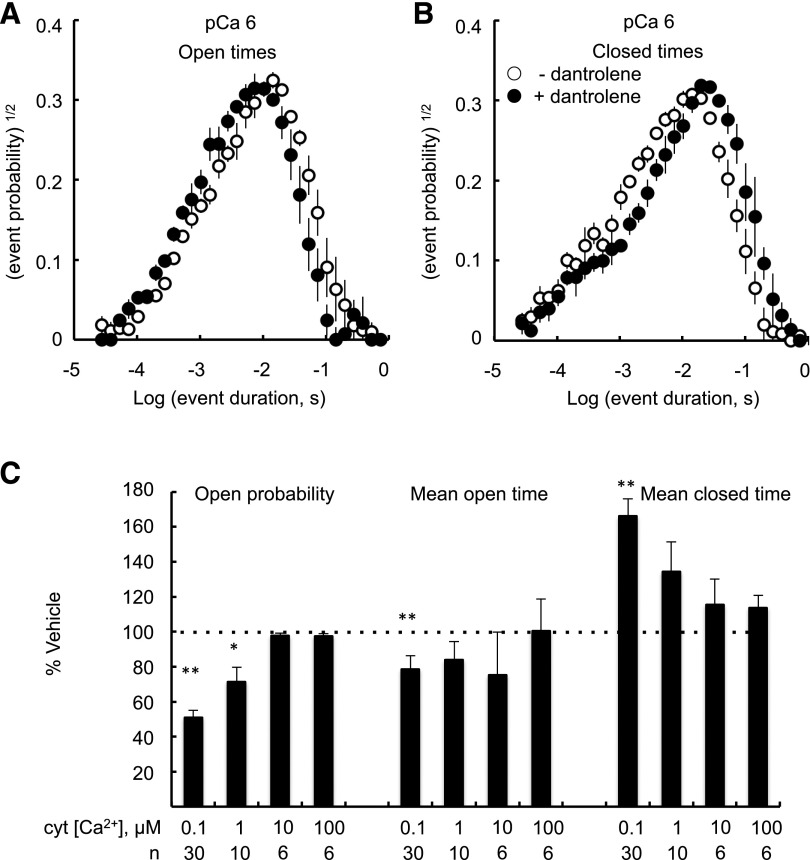
Fig. 2.
Effect of dantrolene on open and closed dwell times of RyR2. Open (A) and closed (B) dwell-time histograms compiled using the log-bin method of Sigworth and Sine (1987) as described in the text. Histograms are averages of three experiments obtained in 1 μM cytoplasmic [Ca2+] in the absence (○) or presence (●) of 10 µM dantrolene. (C) Statistical analysis of open and closed times of dwell-time histograms showing relative changes in mean dwell times induced by 10 µM dantrolene over a range of cytoplasmic (cyt) [Ca2+]. Also shown is the relative inhibition of channel Po. Asterisks indicate significantly different than 100% (*P < 0.05; **P < 0.01).

