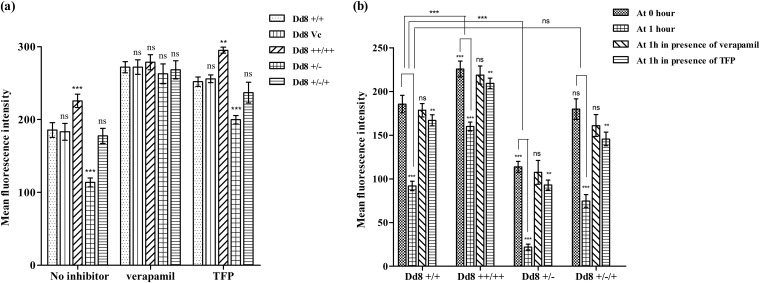
FIG 4.
Graphical representation of a rhodamine assay. (a) Mean fluorescence intensities of accumulated Rhodamine123 after 1 h of loading in the absence or presence of verapamil or trifluoperazine. (b) Mean fluorescence intensities representing rhodamine123 retention at 0 and 1 h of efflux in the absence or presence of verapamil or trifluoperazine. The data represent means ± SD of the results of 3 independent experiments. ***, P < 0.001; **, P < 0.05; ns, not significant.

