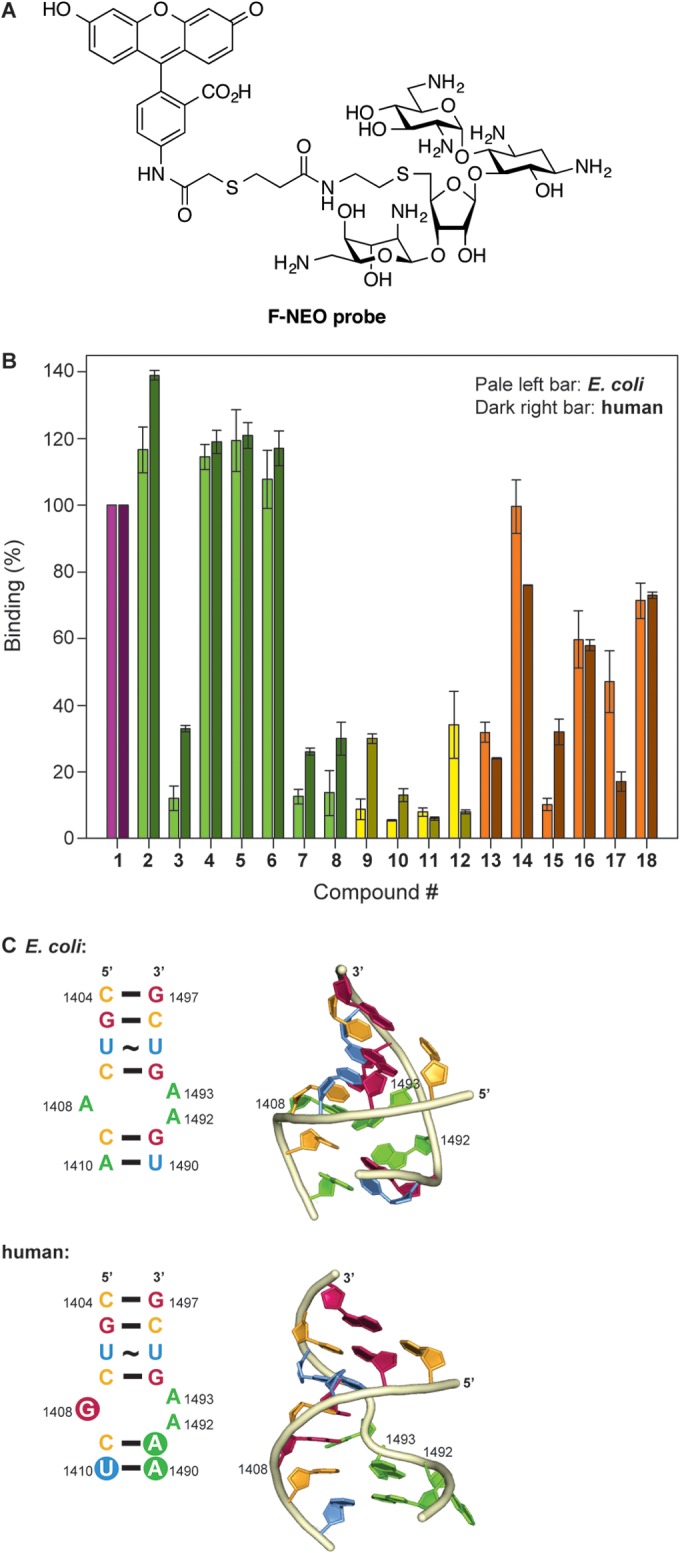
FIG 3.

F-NEO competitive binding screen. (A) Structure of the F-NEO probe used in this study. (B) Bar graph showing the relative rRNA binding of NEO dimers 2 to 18 normalized to NEO (compound 1). NEO (compound 1) and the triazole-, urea-, and thiourea-linked NEO dimers are represented in purple, green, yellow, and orange, respectively. The competitive binding screen of E. coli and human model ribosomal A site are represented in pale color bars on the left and dark color bars on the right for each NEO dimer, respectively. (C) The E. coli A site rRNA (top) and mammalian A site rRNA (bottom) used for the screening assay using F-NEO. The differences between the E. coli and human sequence are highlighted by the filled circles in the secondary structure (left) of the human A site. Key residues of the binding pocket for AGs are labeled in the three-dimensional representation (right) of the E. coli and human A sites. The three dimensional structures were modeled from PDB ID: 1PBR for the E. coli A site and PDB ID: 2FQN for the human A site using only the residues present in the two structures. The bases of the representations are color coded red (guanine), pale orange (cytosine), blue (uracil), and green (adenine) and numbered according to the E. coli ribosome.
