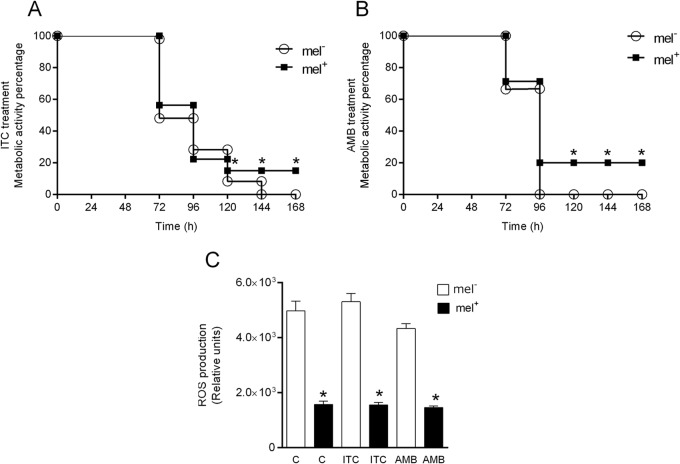
FIG 4.
MTT assay and ROS production after treatment with itraconazole and amphotericin B. (A and B) Metabolic activities of nonmelanized and melanized yeast cells treated with itraconazole (A) and amphotericin B (B) at the MIC. (C) ROS production after treatment with itraconazole and amphotericin B at the MIC. *, statistically significant difference in comparison to nonmelanized cells (P < 0.0001). mel−, nonmelanized cells; mel+, melanized cells. The error bars indicate SEM.

