FIG 1.

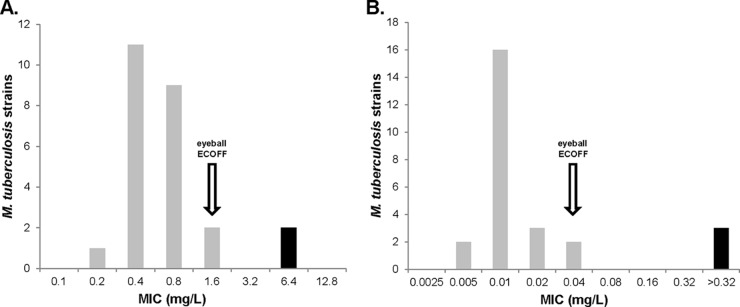
Distribution analysis of MIC values for bedaquiline (A) and delamanid (B). Proposed ECOFF values are marked with an arrow. Wild-type isolates are indicated by gray bars; resistant isolates are indicated by black bars.

Distribution analysis of MIC values for bedaquiline (A) and delamanid (B). Proposed ECOFF values are marked with an arrow. Wild-type isolates are indicated by gray bars; resistant isolates are indicated by black bars.