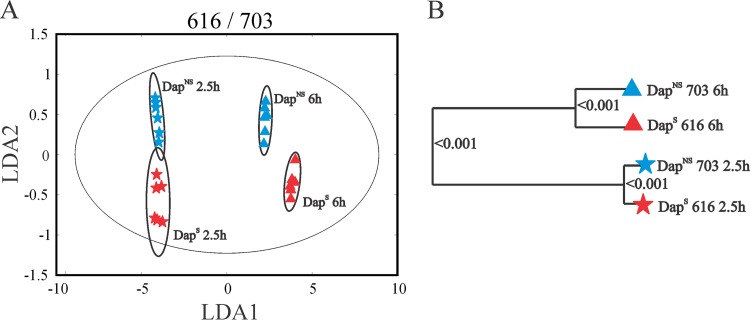
FIG 3.
Metabolic profiles of DapS strain 616 and isogenic derivative DapNS strain 703. Clustering of metabolomes from the exponential (2.5 h) and postexponential (6 h) growth phases examined by PCA of 1D 1H-NMR spectra and then presented by LDA demonstrates significantly different metabolic profiles in the 2D LDA plot (A) and the dendrogram plot (B), both of which are generated from 3D PCA scores. The ellipses correspond to the 95% confidence limits of a normal distribution for each cluster. Each dendrogram node is labeled with a P value; a lower P value indicates a larger separation between the clades.

