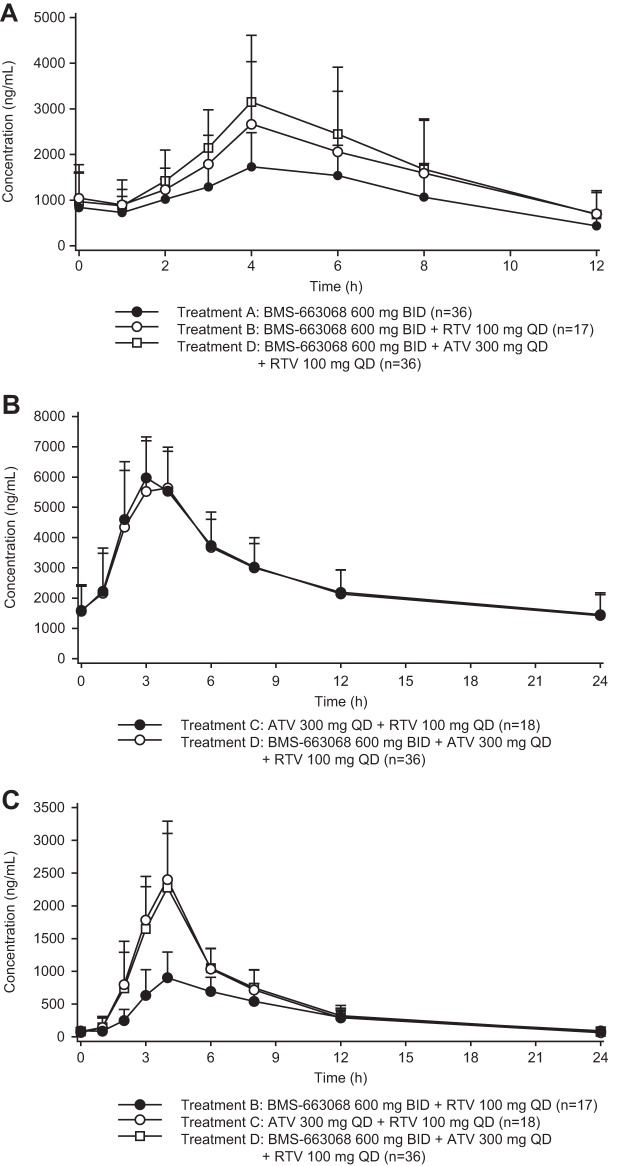
FIG 2.
(A) Mean ± SD plasma concentration-time profiles for BMS-626529 for all subjects receiving treatment A, treatment B, and treatment D. (B) Mean ± SD plasma concentration-time profiles for ATV for all subjects receiving treatment C and treatment D. (C) Mean ± SD plasma concentration-time profiles for RTV for all subjects receiving treatment B, treatment C, and treatment D.

