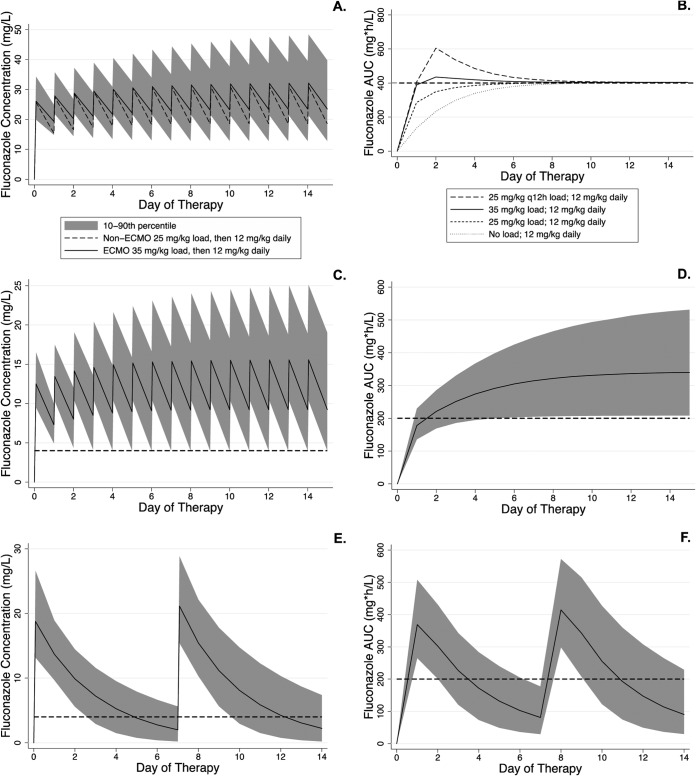
FIG 3.
Simulated fluconazole plasma concentrations and exposure. (A and B) Treatment doses. (C to F) Prophylactic doses. (A) Simulated fluconazole plasma concentrations in children on ECMO (35 mg/kg load) compared to children not on ECMO (25 mg/kg load). Both cohorts received 12 mg/kg daily as maintenance. (B) Simulated fluconazole exposure in children on ECMO after different loading doses. The lines for individual dosing regimens represent the 10th percentile of exposure (i.e., 90% of simulated children above the line). The horizontal dashed line represents the target AUC for therapy. (C and D) Simulated fluconazole plasma concentrations (C) and exposure (D) in children on ECMO receiving 12 mg/kg load and then 6 mg/kg daily. (E and F) Simulated fluconazole plasma concentrations (E) and exposure (F) in children on ECMO receiving 25 mg/kg once weekly. The solid line is the median, and the shaded regions represent the 90% prediction interval. The dashed lines represent an MIC of 4 mg/liter (C and E) and the target AUC for prophylaxis (D and F). The AUC is calculated for a 24-h period for all panels.

