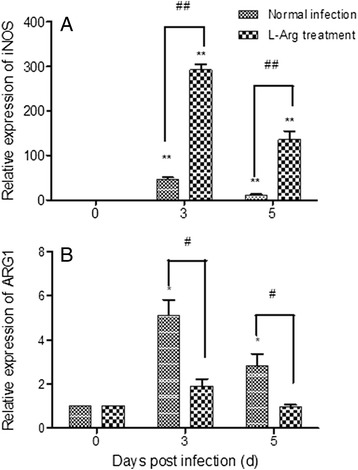
Fig. 1.

Effects of L-Arg treatment iNOS (a) and ARG1 (b). The relative abundance of iNOS and ARG1 in spleen cells were measured by quantitative real-time RT-PCR. Spleen cells were collected from mice prior to Py17XL infection (0), and 3 and 5 dpi. Results are representative of three independent experiments. For each experiment, three mice were used per group. Values represent the mean + SEM.* and ** indicate significant difference between Py17XL infected (3 d and 5 d) and uninfected mice (0 d) at P < 0.01 and P <0.05 (t-test), respectively. # and ## indicate significant difference between D-Arg pretreated control (Normal infection) and L-Arg pretreated mice (L-Arg treatment) at P < 0.01 and P <0.05 (t-test), respectively
