Abstract
Women from breast cancer families without a demonstrable BRCA1/2 mutation were subjected to annual mammography from age 30 years onwards. One-hundred and ninety-eight patients were diagnosed prospectively with invasive breast cancer and followed for a total of 1513 years. Overall 10-year survival was 88 %. Together with our previous report that women in such kindreds had about twice the population risk of breast cancer, the combined conclusion was that the overall chances of developing breast cancer causing death within 10 years before 50 years of age was 1 % or less when subjected to annual mammography and current treatment. These are empirical prospective observations which may be used for genetic counselling. The majority (160/194 = 84 %) of patients had ER+ and/or low grade tumours with 92 % 10-year survival. One minor group of the patients had ER− tumours, another small group had high grade tumours with nodal spread, both groups were associated with worse prognosis, but the two groups were not mutually associated.
Keywords: Familial, Breast cancer, Survival, Prospective study, BRCA testing
Introduction
Family history has been used to identify women at increased risk of developing breast cancer [1]. Women at increased breast cancer risk have been subjected to annual mammography for early diagnosis aiming for early treatment with the hope of improving prognosis [2–5]. The two collaborating centres issuing this report initiated clinical activities more than 20 years ago as open prospective trials, referring all women at appropriate risk to undergo annual mammography. Follow up has been actively sought effectively making the study an open prospective observational trial. We have tested all breast cancer kindreds seen throughout these years for BRCA1/2 mutations [6–10], and we have reported risk for breast cancer in healthy women in breast cancer kindreds without a demonstrable BRCA1/2 mutation [11]. Women with two or more close relatives with breast cancer had 4 % risk for breast cancer before 50 years of age. We here report survival when breast cancer was diagnosed prospectively in kindreds without a demonstrable BRCA1/2 mutation.
Methods
The series include all cases subjected to annual mammography having increased risk for breast cancer due to family history from the outpatient cancer genetic clinics in Manchester (UK) and Oslo (Norway). The Norwegian series included 4115 patients and was censored in September 2013. The UK series included 9500 patients and was censored in October 2013. Women at increased breast cancer risk from families without a demonstrable BRCA1/2 mutation were subjected to annual mammography from age 30–35 years onwards. The annual examinations were performed in dedicated breast cancer diagnostic centres. Examination did not routinely include ultrasound, or MRI, although clinical breast examination was carried out in Manchester. However, USS and occasionally MRI were performed with low threshold if indicated by the results of the mammographic examination. Follow-up for diagnosing cancer was from first to last prospectively planned mammography; in Manchester, women were also checked on the local cancer registry for breast cancer within 2 years after last mammography. In this way, none were lost to follow-up. How the Norwegian and Manchester series were ascertained and genetically tested to exclude causative BRCA1/2 mutations, has previously been described in detail [11, 12]. In short, (a) all available breast and ovarian cancer cases, (b) and/or obligate carriers in the families and (c) all prospectively diagnosed cases were examined by sequencing and MLPA methods, additionally in Norway—if none such were available—(d) healthy women at risk themselves were tested. All families where one or more persons with causative mutation(s) were found, were excluded from the present study.
In the Norwegian series, women at high and moderate breast cancer risk as described in the previous report [11] as well as women with a male relative between the breast cancer case and themselves were initially selected. In the UK series, all women at high or moderate risk (lifetime risk of 1 in 6 or higher [2, 4] based on family history were selected. All cases with breast cancer prior to inclusion or at first prospective mammography were excluded. All breast cancer cases, irrespective of mode of detection, after first prospectively planned mammography were assessed. Survival after first diagnosed breast cancer was calculated, any possible second cancer in any organ was not considered besides for cause of death as described below. Follow-up after cancer included clinical follow-up and continued annual mammography or more frequent according to treatment regimen. In addition, all patients alive according to our medical files when study was censored were checked against population registry for being alive.
The following observations were used for this study: age at diagnosis, age at last follow-up/age at death if dead, tumour size, histopathological grade (grade) scored as low (1), intermediate (2) or high (3), oestrogen receptor (ER) positive (+) or negative (−), carcinoma in situ (CIS)/invasive carcinoma without nodal spread at diagnosis/nodal spread at diagnosis and the cancers were scored as ductal or lobular. Mode of the breast cancer diagnosis was not included as a variable in the present study. Only a few tumours had been tested for HER2 as this was not routine until recently, therefore, HER2 status was not included in the analyses.
Associations between categorised variables were considered by Chi square tests. Differences in distributions for continuous variables were assessed by two-sample t tests. Survival was estimated by the Kaplan–Meier algorithm as time from diagnosis to last follow-up/death. Each patient was scored as alive or dead when censored. Causes of death were identified from the medical files and cancer registry (UK) and patients having died of causes other than breast cancer and not having had spread from breast cancer when dying, were censored as alive to derive a disease-specific survival. Univariate and multivariate hazard rates (HR) for death were calculated by using the Cox proportional hazard method.
Ethics
All patients had consented to genetic testing according to national legislation for health care, and all patients had consented to the current research as approved by national ethical committees.
Results
Two-hundred and forty-one patients were diagnosed to have cancers, 172 (71 %) were screen detected and 69 (29 %) were interval cancers. Of the screen detected cancers, 42 (24 %) were palpable.
Forty-three cases (18 %) had CIS (39 ductal and 4 lobular) and were excluded from further analyses.
Out of 198 cases with infiltrating breast cancer, 194 had been examined once or more after diagnosis and were included in the survival analyses. Mean and median ages at diagnoses were 49.5 and 49.0 years, respectively. They had been observed for a total of 1513 person years, with a mean of 7.6 years and median 7.1 years.
Fifty-four percent of the cases were aged less than 50 years at diagnosis. Eighty-seven percent of the cancers were ductal, 75 % were node negative, 78 % were ER+ and 63 % were grades 1 or 2. Median and mean tumour size at diagnosis was 13 and 15.7 mm, respectively. Nineteen (10 %) had died. See Table 1 for details.
Table 1.
Findings in 198 infiltrating breast cancer cases by categorized variables
| Scoring | Subgroups | Number of cases (% of valid cases) in subgroup |
|---|---|---|
| Type (n* = 193) | Ductal | 168 (87 %) |
| Lobular | 25 (13 %) | |
| Age groups (n* = 198) | <50 years | 106 (54 %) |
| ≥50 years | 92 (46 %) | |
| Nodal status at diagnosis (n* = 197) | Node negative | 147 (75 %) |
| Nodal spread | 50 (25 %) | |
| ER-status (n* = 185) | Negative | 40 (22 %) |
| Positive | 145 (78 %) | |
| Grade (n* = 192) | Low | 38 (20 %) |
| Intermediate | 83 (43 %) | |
| High | 71 (37 %) | |
| Censored (n* = 198) | Alive | 179 (90 %) |
| Dead | 19 (10 %) | |
| Centre (n* = 198) | Norway | 69 (35 %) |
| Manchester | 129 (65 %) |
n* number of cases with valid information in selected group
Table 2 shows mean tumour sizes and ages at diagnosis, and differences as judged by two-sample t tests. Lobular cancers were larger and diagnosed at an earlier age than ductal cancers. Grade 3 tumours were larger than grade 1 tumours (p = 0.000), cases with node positive had larger tumours than node negative cases, while there was no difference in size between ER− and ER+ tumours. There was an insignificant trend that those having died had larger tumours at diagnosis than those still alive.
Table 2.
Results of two-sample t tests for differences between groups
| Groups | Mean tumour size (mm) | p | Mean age at diagnosis (years) | p |
|---|---|---|---|---|
| Ductal | 14.9 | 0.03 | 49.1 | 0.007 |
| Lobular | 23.5 | 53.2 | ||
| Grade 1 | 9.6 | 0.000 | 49.5 | 0.72 |
| Grade 3 | 18.4 | 49.9 | ||
| Node pos | 22.1 | 0.000 | 49.6 | 0.97 |
| Node neg | 13.8 | 49.5 | ||
| ER negative | 17.1 | 0.59 | 48.7 | 0.57 |
| ER positive | 15.8 | 49.5 | ||
| Dead | 22.0 | 0.12 | 48.7 | 0.67 |
| Alive | 15.4 | 49.6 |
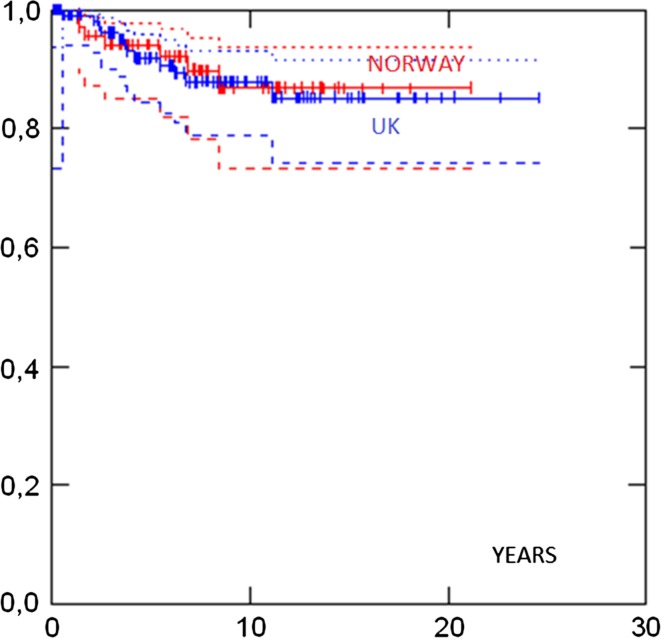
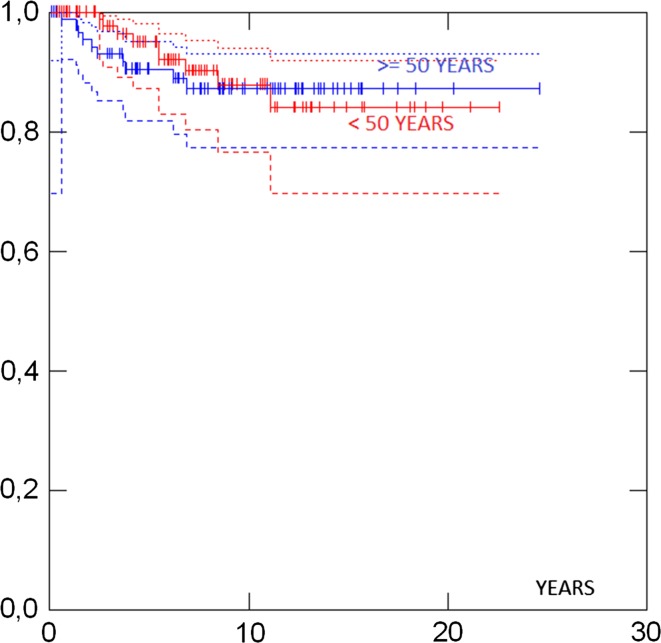
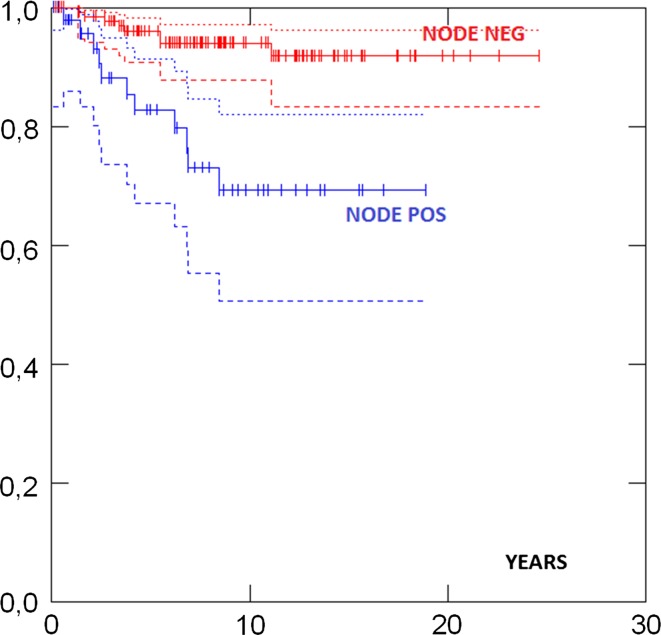
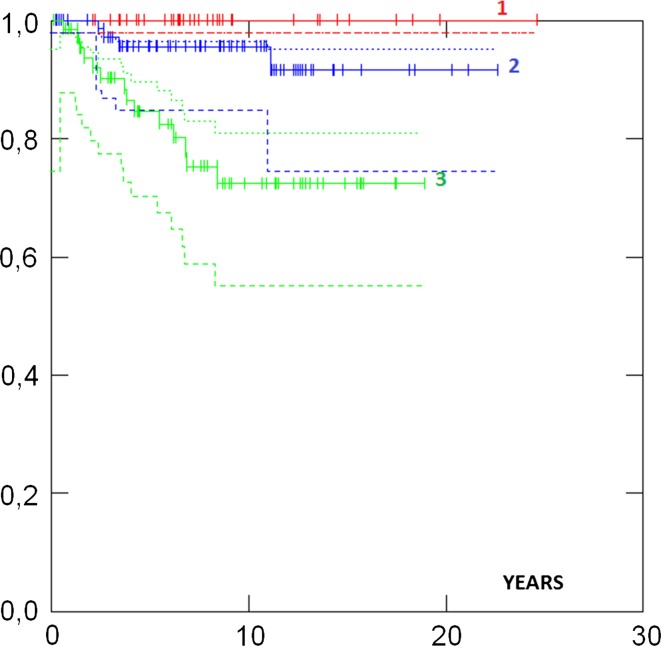
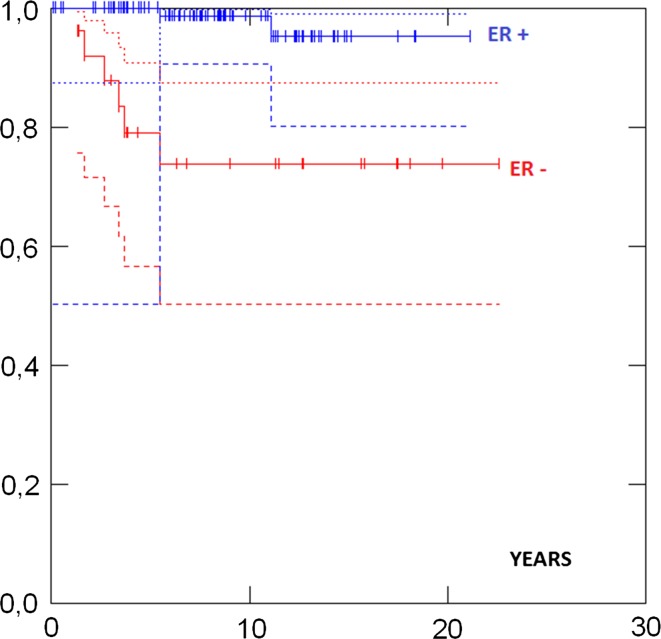
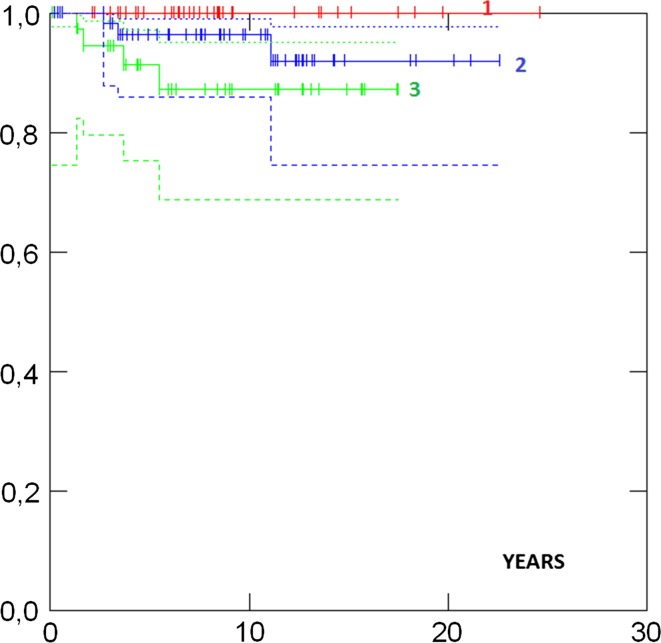
Survival in different groups is given in Table 3. 5- and 10-years survival in all cases were 93 and 88 %, respectively, and there was no difference in survival between the UK and the Norwegian series (Fig. 1). Survival in ductal and lobular cases was similar. Survival was similar in patients aged less than 50 versus more than 50 years at diagnosis (Fig. 2). No case with a grade 1 tumour had died. Cases with ER+ grade 2 tumours also had good prognosis. Eighty-two percent had grade 1 or grade 2 or ER+ tumours and as a combined group had 92 % 10-years survival. ER−, and N+ (Fig. 3) and Grade 3 (Fig. 4) were associated with a higher likelihood of death (p = 0.000). ER− tumours were associated with increased mortality even when node negative cases were considered separately (Fig. 5), while tumour grade was not significantly associated with death in node negative cases (Fig. 6).
Table 3.
Survival in different groups and results of Mantel tests for differences between groups
| Selection | Subgroups | Number of cases included | 5 years survival (95 % CI) | 10 years survival (95 % CI) | p |
|---|---|---|---|---|---|
| All | All | 194 | 93 % (88–96) | 88 % (81–92) | |
| Norway | 69 | 94 % (85–98) | 90 % (78–95) | 0.85 | |
| Manchester | 125 | 92 % (84–96) | 88 % (79–93) | ||
| <50 years | 103 | 95 % (87–98) | 88 % (77–94) | 0.80 | |
| 50 + years | 91 | 91 % (82–95) | 87 % (77–93) | ||
| Ductal | 165 | 93 % (87–96) | 89 % (81–93) | 0.33 | |
| Lobular | 24 | 91 % (66–98) | 85 % (60–95) | ||
| ER neg | 40 | 74 % (56–86) | 67 % (52–83) | 0.000 | |
| ER pos | 142 | 98 % (93–99) | 93 % (85-97) | ||
| Grade 1 | 38 | 100 % | 100 % | 0.000 | |
| Grade 2 | 81 | 96 % (87–99) | 96 % (87–99) | ||
| Grade 3 | 69 | 85 % (72–92) | 72 % (57–83) | ||
| N− | 143 | 96 % (91–98) | 94 % (88–97) | 0.000 | |
| N+ | 50 | 83 % (67–91) | 69 % (51–82) | ||
| Grade 1, Grade 2 or ER+ | 160 | 96 % (91–99) | 92 % (85–96) | ||
| N− | Grade 1 | 38 | 100 % | 100 % | 0.11 |
| Grade 2 | 64 | 96 % (86–99) | 96 % (86–99) | ||
| Grade 3 | 38 | 91 % (75–97) | 87 % (69–95) | ||
| ER pos | 107 | 100 % | 99 % (91–100) | 0.000 | |
| ER neg | 26 | 79 % (57–91) | 74 % (50–87) | ||
| Grade 3 and ER− | 31 | 73 % (51–86) | 63 % (40–79) | ||
| N + and ER− | 13 | 63 % (29–85) | 53 % (20–77) | ||
| N + and Grade 3 and ER− | 11 | 55 % (18–81) | 41 % (10–71) |
Fig. 1.
Survival by country
Fig. 2.
Survival by age at diagnosis
Fig. 3.
Survival by nodal status at diagnosis p = 0.000
Fig. 4.
Survival by tumour grade p = 0.000
Fig. 5.
Selection node negative survival by ER receptor status p = 0.000
Fig. 6.
Selection node negative survival by tumour grade p = 0.11
Grade and nodal status were highly associated (p = 0.000), but ER and nodal status at diagnosis were not associated, p = 0.25 (Table 4).
Table 4.
Nodal status at diagnosis versus tumour receptor status and grade
| Node negative | Node positive | p | |
|---|---|---|---|
| ER− | 26 | 13 | 0.25 |
| ER+ | 110 | 35 | |
| Grade 1 | 38 | 0 | 0.000 |
| Grade 2 | 66 | 17 | |
| Grade 3 | 40 | 30 |
By univariate Cox proportional hazard, ER, grade and nodal status were associated with death, while age at diagnosis and tumour size at diagnosis were not associated with death (Table 5).
Table 5.
Results univariate Cox proportional hazard for death
| Number of cases | Number of deaths | HR (95 % CI) | p value | log-rank p value | |
|---|---|---|---|---|---|
| Age | |||||
| 25–49 | 94 | 7 | 1 | 0.425 | |
| 50+ | 81 | 10 | 1.48 (0.56–3.89) | 0.428 | |
| Size | |||||
| 0.1–1.0 cm | 63 | 4 | 1 | 0.147 | |
| 1.1–2.0 cm | 72 | 6 | 1.28 (0.36–4.55) | 0.700 | |
| 2.1–7.0 cm | 40 | 7 | 2.89 (0.85–9.86) | 0.091 | |
| ER | |||||
| Negative (1) | 38 | 10 | 1 | 0.00016 | |
| Positive (3) | 137 | 7 | 0.19 (0.07–0.50) | 0.001 | |
| Grade | |||||
| Low* or intermediate | 108 | 3 | 1 | 0.00006 | |
| High | 67 | 14 | 8.38 (2.41–29.18) | 0.001 | |
| Nodal status | |||||
| Negative | 130 | 6 | 1 | 0.00004 | |
| Positive | 45 | 11 | 6.28 (2.32–17.01) | 0.0003 | |
* No death in cases with low grade
By multivariate Cox proportional hazard ER, grade and nodal status were associated with increased mortality while age and size were not (Table 6).
Table 6.
Results multivariate Cox proportional hazard for death
| Number of cases | HR (95 % CI) | p value | |
|---|---|---|---|
| Age | |||
| 25–49 | 94 | 1 | |
| 50+ | 81 | 2.45 (0.88–6.81) | 0.086 |
| Size | |||
| 0.1–1.0 cm | 63 | 1 | |
| 1.1–2.0 cm | 72 | 0.59 (0.15–2.25) | 0.438 |
| 2.1–7.0 cm | 40 | 1.23 (0.30–5.09) | 0.772 |
| ER | |||
| Negative | 38 | 1 | |
| Positive | 137 | 0.25 (0.09–0.71) | 0.009 |
| Grade | |||
| Low* or intermediate | 108 | 1 | |
| High | 67 | 4.42 (1.18–16.56) | 0.027 |
| Nodal status | |||
| Negative | 130 | 1 | |
| Positive | 45 | 4.08 (1.28–13.06) | 0.018 |
* No death in cases with low grade
Discussion
Overall 10-year survival in initially healthy women from BRCA1/2 negative familial breast cancer families, who had prospectively detected cancers when subjected to annual mammography, was 88 %. These results add to our previous report that women in such kindreds had about twice the population risk of breast cancer, and may be used for genetic counselling. Considering the previous and the current findings together, the risk of developing a breast cancer before 50 years of age was about 2 %, which multiplied by a 12 % risk of dying from that breast cancer within 10 years, when subjected to annual Mx from 30 years of age, gives a combined risk of less than 1 % to contract an early breast cancer causing death within 10 years. Or—vice versa—the probability to not have an early breast cancer causing death within 10 years was >99 %. These were our combined empirical observations in patients from breast cancer kindreds without demonstrable BRCA mutations subjected to annual mammography from 30 years of age and with current breast cancer treatment. These data could be used for genetic counselling of women at moderate breast cancer risk.
With the increasing availability and reduced cost of genetic testing, one may consider testing a healthy woman with a family history of breast cancer directly and not—as has been done so far—test affected relatives initially. If doing so, the question of risk for breast cancer in BRCA1/2 carrying kindreds in women not having the family’s BRCA mutation will become an issue to clarify [13], as will the biology of such breast cancers. There is a possibility that some families with highly penetrant BRCA1/2 mutations may have additional (genetic) factors causing breast cancer (independently or modifiers of BRCA1/2 penetrance). Studies are ongoing to address this.
We have reported the outcome of our health service as applied since the start of the activity. The scope of our study was survival from breast cancer in those accepting our offer of annual mammography from 30 years onwards and current treatment once cancer was diagnosed. The examinations were part of the health care system, and both patient compliance and capacity problems in the diagnostic outpatient clinics might have postponed some examinations for some time. We did not focus on screen-detected versus interval cancers (which anyway is difficult when some patients because of the frequent examinations felt a lump but did not inform us until the next scheduled mammography). If considering details on time between examination, screen-detected versus interval cancers, and compared those with tumour characteristics such as grade, ER, nodal status and size, the strata would be too many for meaningful calculations in our limited series. The results were that most patients in this highly selected series had low grade and/or ER+ tumours which was associated with very good survival. Survival was so good that stratification of this group with respect to survival is of little interest. In contrast, two infrequent subgroups (ER− and high grade) had worse outcome, and numbers did not allow meaningful substratification of these two groups. These patients are now being subjected to sequencing for many more genes known to be associated with breast cancer in search of biological causative factors.
Surprisingly, young age at diagnosis was not associated with worse survival as has been previously published for unscreened women [14, 15] (Figure 2). We were not able to conduct a direct comparison with similar family history positive women not undergoing intensive mammography screening. However, it is of note that the 88 % 10-year survival for invasive breast cancer compares favourably to the 71.5 % 10-year survival for all women in the UK diagnosed in 2000–2001 [16] approximating to the median age at diagnosis in our report. Survival in unscreened family history positive women diagnosed with breast cancer in the UK under 40 years of age between 2000 and 2008 was poor in a recent study with only 70 % being alive without metastasis at a mean of 7-year follow-up [16] and with 8-year overall survival of only 67.3 % for all women [15]. Also, 10 year survival was better in the group described here than in inherited breast cancer caused by BRCA1 mutations [17].
The associations between the findings lead us to the following speculations
A small proportion of the cases had grade 3 and/or ER− and/or were node positive and carried a worse prognosis, but ER− and node positive were not associated with each other. It is interesting that the effect on mortality on having a tumour an ER− tumour and being node positive, was additive (Table 3). Numbers included were, however, limited, and we look forward to see results from other centres on this specific issue.
Conclusions
In women at increased familial breast cancer risk without a demonstrable BRCA1/2 mutation, the overall chances of developing breast cancer causing death within 10 years before 50 years of age was less than 1 % when subjected to annual mammography and current treatment. The majority of patients had ER+ and/or grade 1 or 2 tumours, and survived. A minor fraction of the patient had ER− tumours and/or nodal spread at diagnosis, both of which were associated with worse prognosis but ER+ and nodal spread at diagnosis were not associated. The results to us indicated that annual mammography from 30 years of age should be continued while the search for more genes that cause inherited breast cancer continues [18]. Hopefully, one may arrive at understanding why some patients have worse prognosis and develop more effective personalised preventive and/or treatment modalities.
Acknowledgments
We acknowledge the support of the Genesis Breast Cancer Prevention Appeal and Breast Cancer Campaign who fund the FH02 study which concerned women aged 35–39 years. DGE is a NIHR Senior investigator.
Conflict of interests
The authors declare that they have no conflict of interest.
References
- 1.Fischer C, Kuchenbäcker K, Engel C, et al. Evaluating the performance of the breast cancer genetic risk models BOADICEA, IBIS, BRCAPRO and Claus for predicting BRCA1/2 mutation carrier probabilities: a study based on 7352 families from the German Hereditary Breast and Ovarian Cancer Consortium. J Med Genet. 2013;50(6):360–377. doi: 10.1136/jmedgenet-2012-101415. [DOI] [PubMed] [Google Scholar]
- 2.Lalloo F, Boggis CR, Evans DG, Shenton A, Threlfall AG, Howell A. Screening by mammography, women with a family history of breast cancer. Eur J Cancer. 1998;34(6):937–940. doi: 10.1016/S0959-8049(98)00005-7. [DOI] [PubMed] [Google Scholar]
- 3.Møller P, Evans G, Haites N, et al. Guidelines for follow-up of women at high risk for inherited breast cancer: consensus statement from the Biomed 2 Demonstration Programme on Inherited Breast Cancer. Dis Markers. 1999;15(1–3):207–211. doi: 10.1155/1999/920109. [DOI] [PMC free article] [PubMed] [Google Scholar]
- 4.Maurice A, Evans DG, Shenton A, et al. Screening younger women with a family history of breast cancer–does early detection improve outcome? Eur J Cancer. 2006;42(10):1385–1390. doi: 10.1016/j.ejca.2006.01.055. [DOI] [PubMed] [Google Scholar]
- 5.Maurice A, Evans DG, Affen J, Greenhalgh R, Duffy SW, Howell A. Surveillance of women at increased risk of breast cancer using mammography and clinical breast examination: further evidence of benefit. Int J Cancer. 2012;131(2):417–425. doi: 10.1002/ijc.26394. [DOI] [PubMed] [Google Scholar]
- 6.Evans DG, Shenton A, Woodward E, Lalloo F, Howell A, Maher ER. Penetrance estimates for BRCA1 and BRCA2 based on genetic testing in a clinical cancer genetics service setting: risks of breast/ovarian cancer quoted should reflect the cancer burden in the family. BMC Cancer. 2008;30(8):155. doi: 10.1186/1471-2407-8-155. [DOI] [PMC free article] [PubMed] [Google Scholar]
- 7.Møller P, Maehle L, Vabø A, Clark N, Sun P, Narod SA. Age-specific incidence rates for breast cancer in carriers of BRCA1 mutations from Norway. Clin Genet. 2013;83(1):88–91. doi: 10.1111/j.1399-0004.2012.01855.x. [DOI] [PubMed] [Google Scholar]
- 8.Evans DG, Kesavan N, Lim Y, et al. MRI breast screening in high-risk women: cancer detection and survival analysis. Breast Cancer Res Treat. 2014;145(3):663–672. doi: 10.1007/s10549-014-2931-9. [DOI] [PubMed] [Google Scholar]
- 9.Møller P, Stormorken A, Jonsrud C, et al. Survival of patients with BRCA1-associated breast cancer diagnosed in an MRI-based surveillance program. Breast Cancer Res Treat. 2013;139(1):155–161. doi: 10.1007/s10549-013-2540-z. [DOI] [PubMed] [Google Scholar]
- 10.Evans DG, Harkness E, Lalloo F, Howell A. Long-term prospective clinical follow-up after BRCA1/2 presymptomatic testing: BRCA2 risks higher than in adjusted retrospective studies. J Med Genet. 2014;51(9):573–580. doi: 10.1136/jmedgenet-2014-102336. [DOI] [PubMed] [Google Scholar]
- 11.Møller P, Stormorken A, Holmen MM, Hagen AI, Vabø A, Mæhle L. The clinical utility of genetic testing in breast cancer kindreds: a prospective study in families without a demonstrable BRCA mutation. Breast Cancer Res Treat. 2014;144(3):607–614. doi: 10.1007/s10549-014-2902-1. [DOI] [PMC free article] [PubMed] [Google Scholar]
- 12.Ingham SL, Warwick J, Buchan I, Sahin S, O’Hara C, Moran A, Howell A, Evans DG. Ovarian cancer among 8005 women from a breast cancer family history clinic: no increased risk of invasive ovarian cancer in families testing negative for BRCA1 and BRCA2. J Med Genet. 2013;50(6):368–372. doi: 10.1136/jmedgenet-2013-101607. [DOI] [PubMed] [Google Scholar]
- 13.Evans DG, Harkness E, Lalloo F, Howell A. Long-term prospective clinical follow-up after BRCA1/2 presymptomatic testing: BRCA2 risks higher than in adjusted retrospective studies. J Med Genet. 2014;51(9):573–580. doi: 10.1136/jmedgenet-2014-102336. [DOI] [PubMed] [Google Scholar]
- 14.Copson E, Eccles B, Maishman T, et al. Prospective observational study of breast cancer treatment outcomes for UK women aged 18–40 years at diagnosis: the POSH study. J Natl Cancer Inst. 2013;105(13):978–988. doi: 10.1093/jnci/djt134. [DOI] [PubMed] [Google Scholar]
- 15.http://www.cancerresearchuk.org/cancer-info/cancerstats/types/breast/survival/breast-cancer-survival-statistics. Accessed 19 May 2015
- 16.Evans DG, Thomas S, Caunt J, et al. Mammographic surveillance in women aged 35–39 at enhanced familial risk of breast cancer (FH02) Fam Cancer. 2014;13(1):13–21. doi: 10.1007/s10689-013-9661-8. [DOI] [PubMed] [Google Scholar]
- 17.Tharmaratnam K, Hagen AI, Møller P. MRI screening of women with hereditary predisposition to breast cancer: diagnostic performance and survival analysis. Breast Cancer Res Treat. 2014;148(3):687–688. doi: 10.1007/s10549-014-3178-1. [DOI] [PMC free article] [PubMed] [Google Scholar]
- 18.Michailidou K, Beesley J, Lindstrom S, et al. Genome-wide association analysis of more than 120,000 individuals identifies 15 new susceptibility loci for breast cancer. Nat Genet. 2015;47(4):373–380. doi: 10.1038/ng.3242. [DOI] [PMC free article] [PubMed] [Google Scholar]


