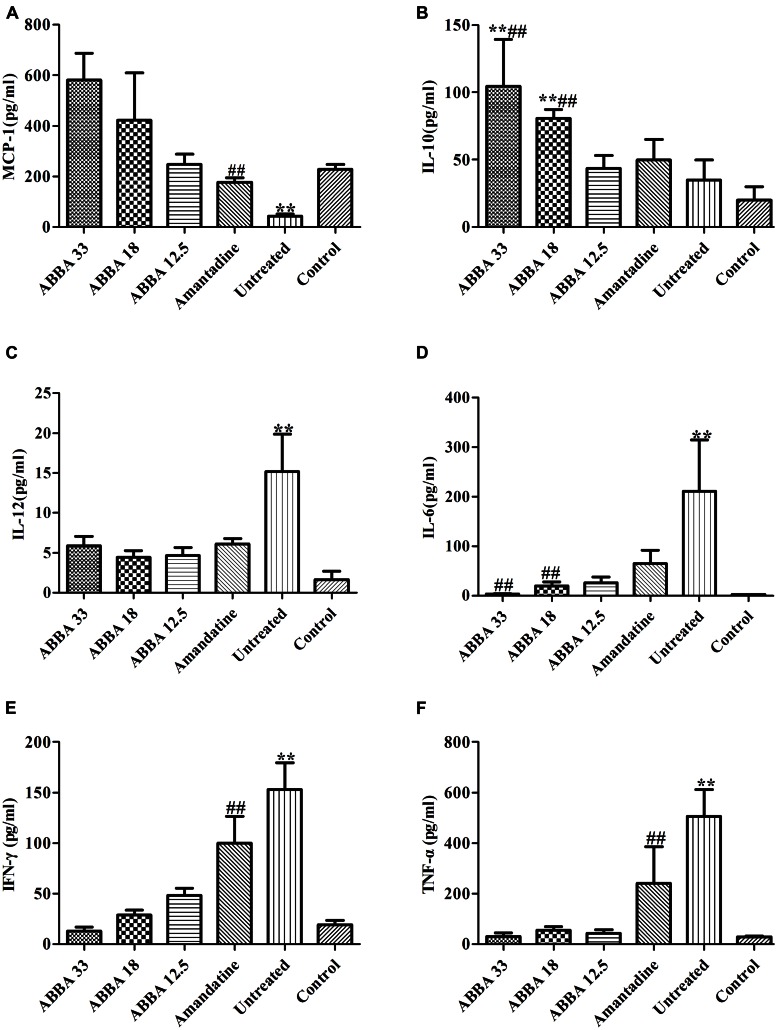
FIGURE 4.
The effect of dryocrassin ABBA on the levels of the inflammatory cytokines and anti-inflammatory cytokines (TNF-α, IFN-γ, IL-12, IL-6, IL-10, and MCP-1) in BALF by flow cytometry assay on day 7 post infection. (A) The concentration of MCP-1. ∗∗P< 0.01 when the untreated group was compared with dryocrassin ABBA-treated groups or amantadine-treated group; ##P< 0.01 when the amantadine group was compared with dryocrassin ABBA-treated groups. (B) The concentration of IL-10. ∗∗P< 0.01 when the 33 and 18 mg/kg dryocrassin ABBA-treated groups were compared with the untreated group; ##P< 0.01 when the 33 and 18 mg/kg dryocrassin ABBA-treated groups were compared with the amantadine group. (C) The concentration of IL-12. ∗∗P< 0.01 when the untreated group was compared with the amantadine- or dryocrassin ABBA-treated groups. (D) The concentration of IL-6. ∗∗P< 0.01 when the untreated group was compared with the amantadine- or dryocrassin ABBA-treated groups; ##P< 0.01 when the 33 and 18 mg/kg dryocrassin ABBA-treated groups were compared with the amantadine group. (E) The concentration of IFN-γ. ∗∗P< 0.01 when the untreated group was compared with the amantadine- or dryocrassin ABBA-treated groups; ##P< 0.01 when the dryocrassin ABBA-treated groups were compared with the amantadine group. (F) The concentration of TNF-α. ∗∗P< 0.01 when the untreated group was compared with the amantadine- or dryocrassin ABBA-treated groups; ##P< 0.01 when the dryocrassin ABBA-treated groups were compared with the amantadine group.

