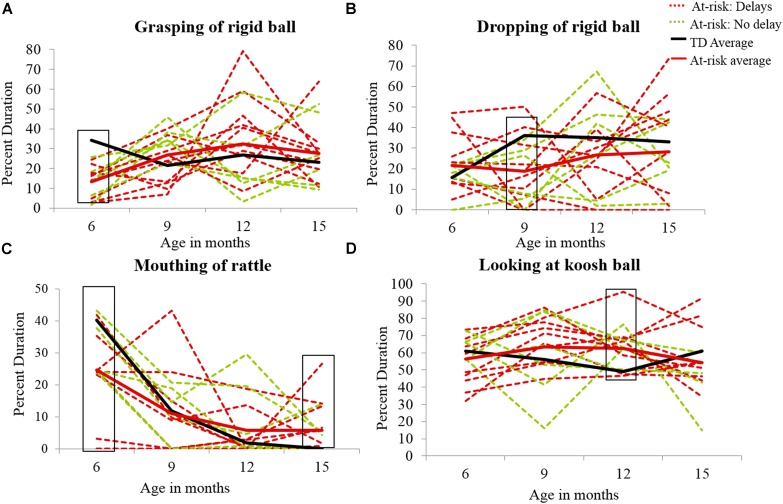
FIGURE 7.
Individual data for grasping of the rigid ball (A), dropping of the rigid ball (B), mouthing of the rattle (C), and looking at the koosh ball (D) in at-risk infants. The solid black line represents the average of the typically developing group and the solid red line represents the average of the at-risk group. The red dotted lines represent the 10 at-risk infants with future delays/ASD diagnosis, and the green dotted lines represent the at-risk infants without any future delays. The black boxes highlight the group differences with the majority of the at-risk infants performing worse than the typically developing group average.

