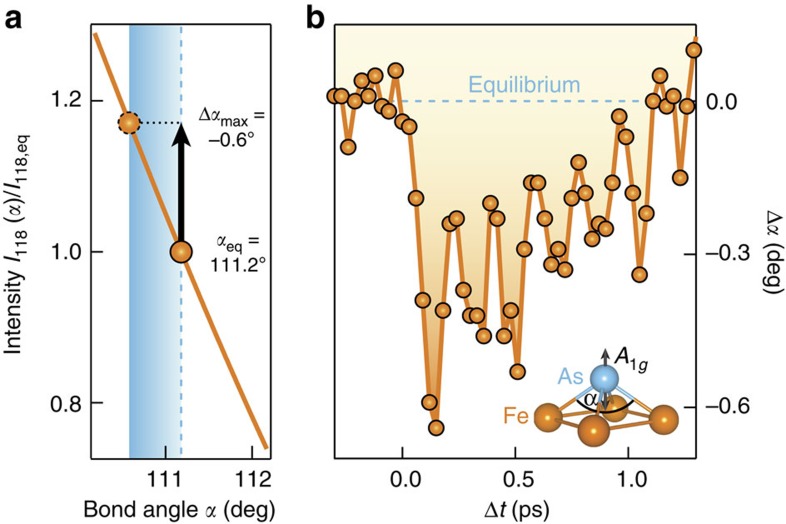
Figure 5. Dynamics of the Fe–As–Fe bond angle.
(a) Dependence of the (118)T Bragg peak intensity on the bond angle α from a structure factor calculation (orange line). The shaded area indicates the magnitude of the initial change Δαmax=−0.62(4)°, as obtained by comparison with the maximal intensity change of the integrated Bragg peak intensity in Fig. 4b. (b) The deduced temporal evolution Δα(t) from the raw data (without deconvolution of the finite time resolution), reveals an A1g oscillation amplitude Δαosc=0.27(8)°, following the initial decrease of α. The errors of Δαmax and Δαosc correspond to 1 s.d.

