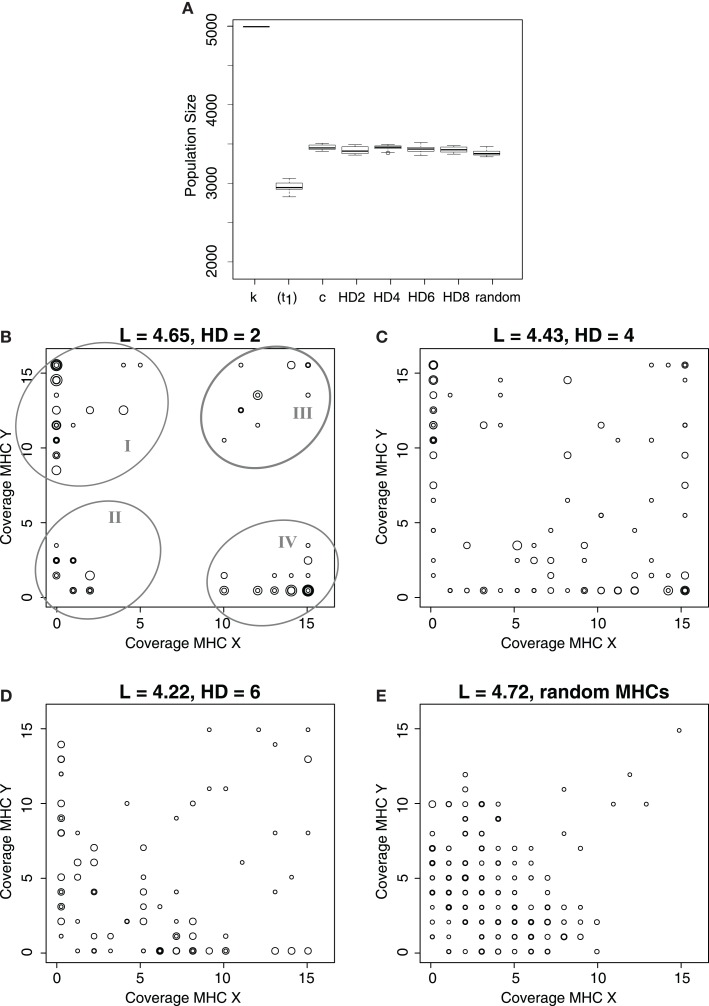
Figure 3.
Evolution of MHC-X and MHC-Y detectors depends on the similarity of the MHC molecules. (A) depicts the average population size out of 10 simulations at the carrying capacity (k), immediately after the infection, i.e., t1 = 10000 (for HD 2), and at tend, for simulations considering different similarity in the MHC molecules. As a control, c, we simulate populations infected with both viruses, where the probability of clearing the infection is maximal (i.e., pcl = 0.6) does not depend on the iNKR-MHC interactions. After a long evolutionary period, all populations evolve immunity. (B–E) show the MHC coverage per iNKR and the average binding threshold (L) at tend out of all 10 simulations. Each host population has a different degree of MHC-I similarity, with HD = 2 (C), HD = 4 (C), HD = 6 (D), and completely random MHC molecules (E). Each iNKR is depicted by one circle, the size of which represents its frequency in the population. The position of each circle shows how many MHC-X and MHC-Y molecules in the population each iNKR can recognize. The boxes in (A) represent the interquartile range, and the bold horizontal lines represent the median taken out of 10 simulations.

