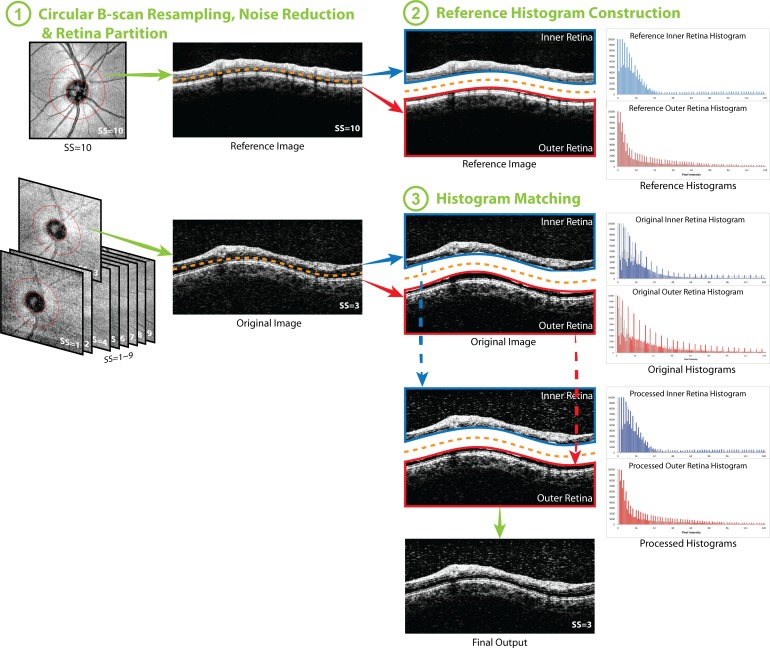
Figure 1.
Flow chart of the histogram matching (HM) method. (1) Circular B-scan was resampled along the 3.4-mm diameter circle (the red circle on the en face image, left column) centered to the optic nerve head for each image. After speckle noise reduction, the circular scans were partitioned into two halves: inner and outer retina. (2) Histograms of inner and outer retina from the image with highest signal strength were set as the reference histograms. (3) The HM was applied to inner and outer retina respectively, and finally combined together to generate the histogram matched image (final output). The ranges of vertical and horizontal axes were adjusted in the figure for better visualization of the histogram and the effect of the processing. After HM, the processed histograms almost overlapped with the reference histograms, which are presented as the gray shadow in the histograms in (3).

