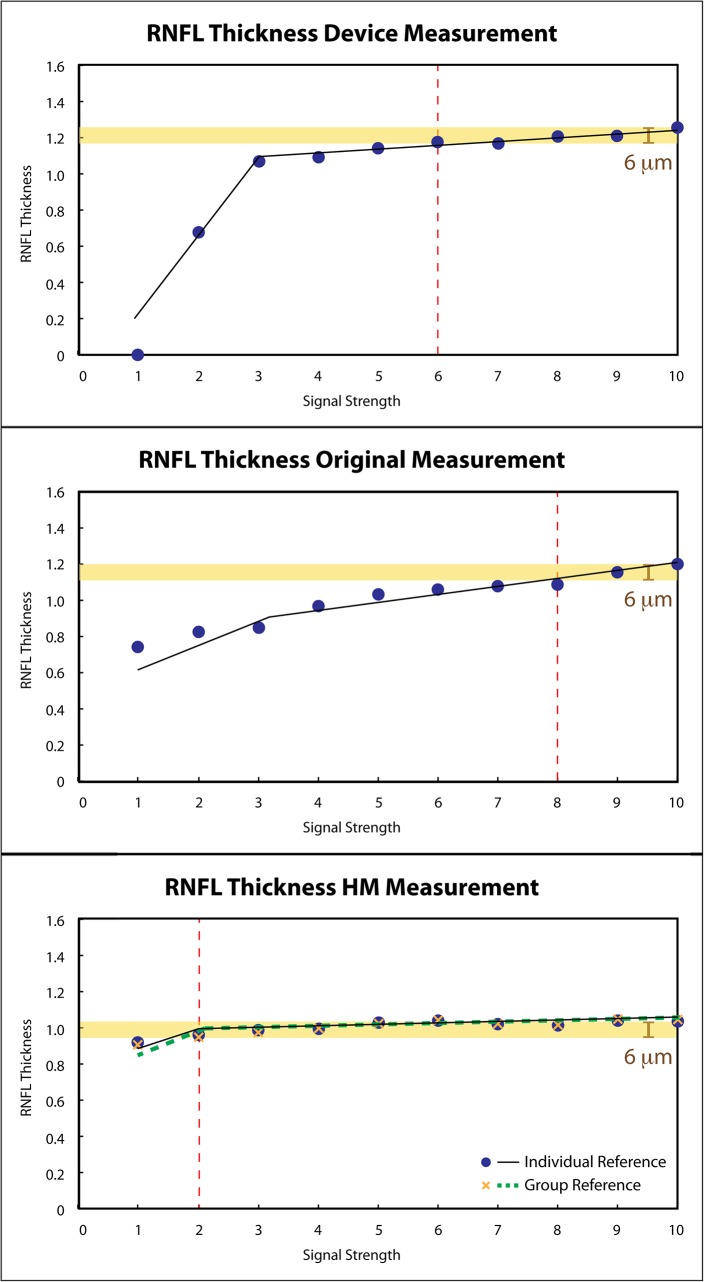
Figure 6.
Relationships between thickness measurements and SS. Circumpapillary RNFL thicknesses from one subject were plotted against SS with two segments of the linear relationships on the device (top), original (middle), and HM (bottom) measurements. The original measurements show larger absolute measurement difference in the higher SS segment. While with HM, the same maximum absolute difference (yellow band) within the manufacturer recommended acceptable SS range on the device (top, SS 6–10) was achieved at a lower SS (SS = 2). Red vertical dash lines in the original and HM plots indicate the lowest SS that has the same RNFL measurement variability as the standard SS range in device measurements. The RNFL thicknesses were normalized to mean thickness value for each method.

